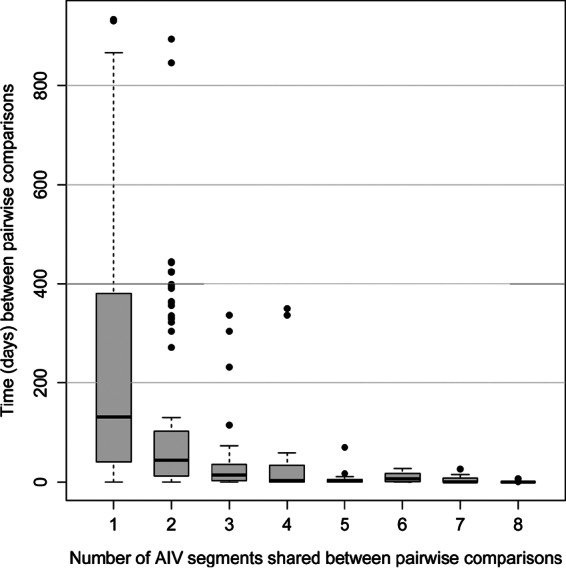
FIG 4.

Plot representing the times (days) between samplings for isolates sharing one to eight gene segments with isolates from the Mississippi Migratory Flyway at the 1% cutoff value. The y axis (time) represents the entirety of study sampling, which occurred throughout three migratory seasons (2008 to 2011).
