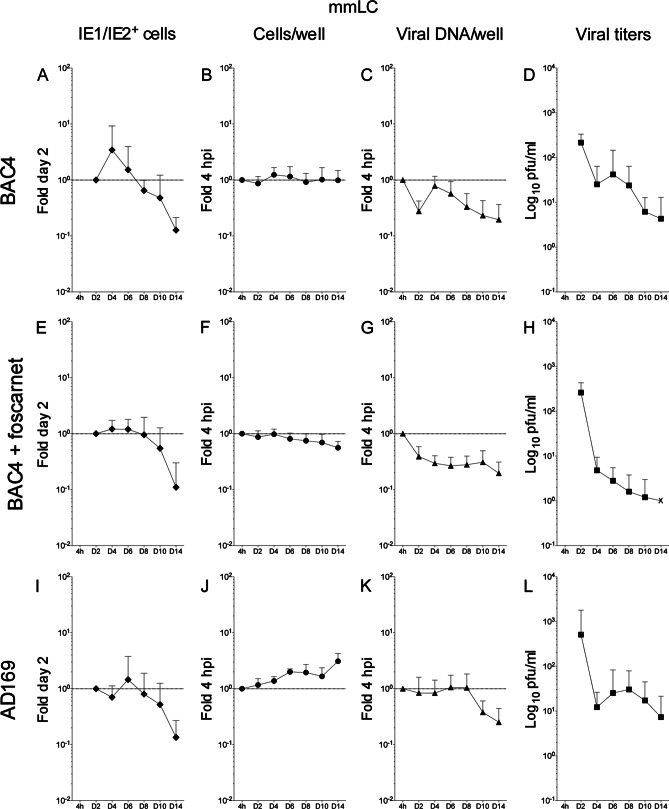
FIG 6.
Kinetics of TB40-BAC4 and AD169varATCC infection in mmLC. Mature LC obtained after 2 days of LPS and CD40L stimulation of iLC differentiated from uninfected CD34+ progenitors were exposed to TB40-BAC4 (A to H) or AD169varATCC (I to L) virions for 4 h prior to washing and further culture in maturation medium in the presence (E to H) or not of 300 μg/ml of foscarnet. Cells and supernatants were collected every 2 days. Data were collected as described in the legend to Fig. 4. The “IE1/IE2+ cells” and “viral titers” graphs show mean and standard deviation values of data collected from five donors in five (A), four (E), and six (D) independent experiments, from four donors in four independent experiments (L), and from three donors in three (I) and two (H) independent experiments. The “cells per well” and “viral DNA/well” graphs show median and median absolute deviation values of data collected from six donors in six independent experiments (B and C), five donors in four independent experiments (F and G), and three donors in four independent experiments (J and K). The dotted line marks the 1-fold point on the y axis.

