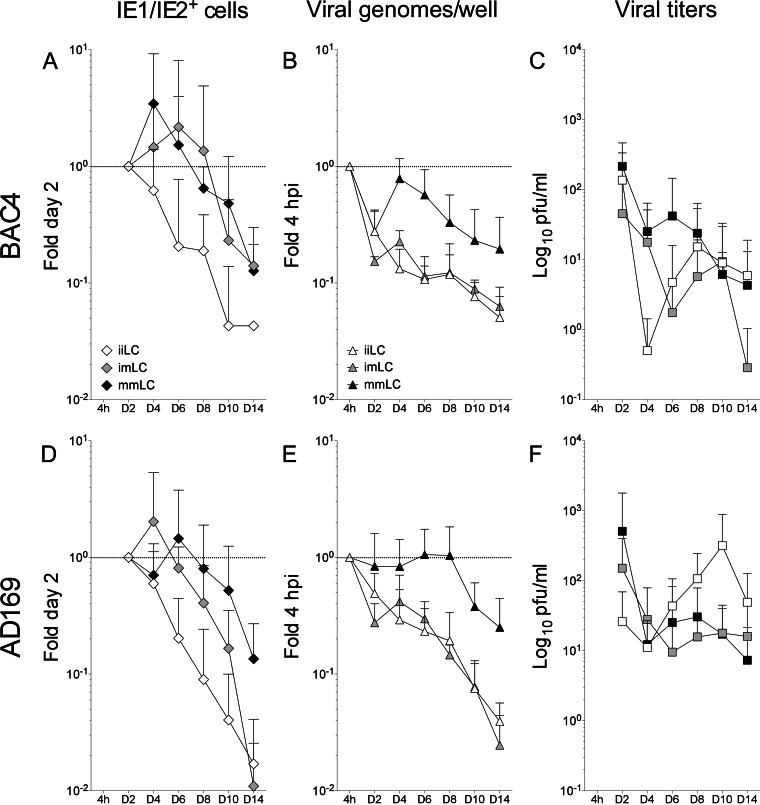
FIG 7.
Comparison of TB40-BAC4 and AD169varATCC infection kinetics in iiLC, imLC, and mmLC. The data shown in this figure are the same as in Fig. 4, 5, and 6 but rearranged for direct comparison of the proportions of IE1/IE2+ cells (A and D) and of viral genomes per well (B and E) present at each time point relative to those at day two and at 4 hpi, respectively, and of the amounts of viral particles released in the culture supernatants (C and F) after TB40-BAC4 or AD169varATCC infection of iiLC (white symbols), imLC (gray symbols), and mmLC (black symbols). The dotted line marks the 1-fold point on the y axis.

