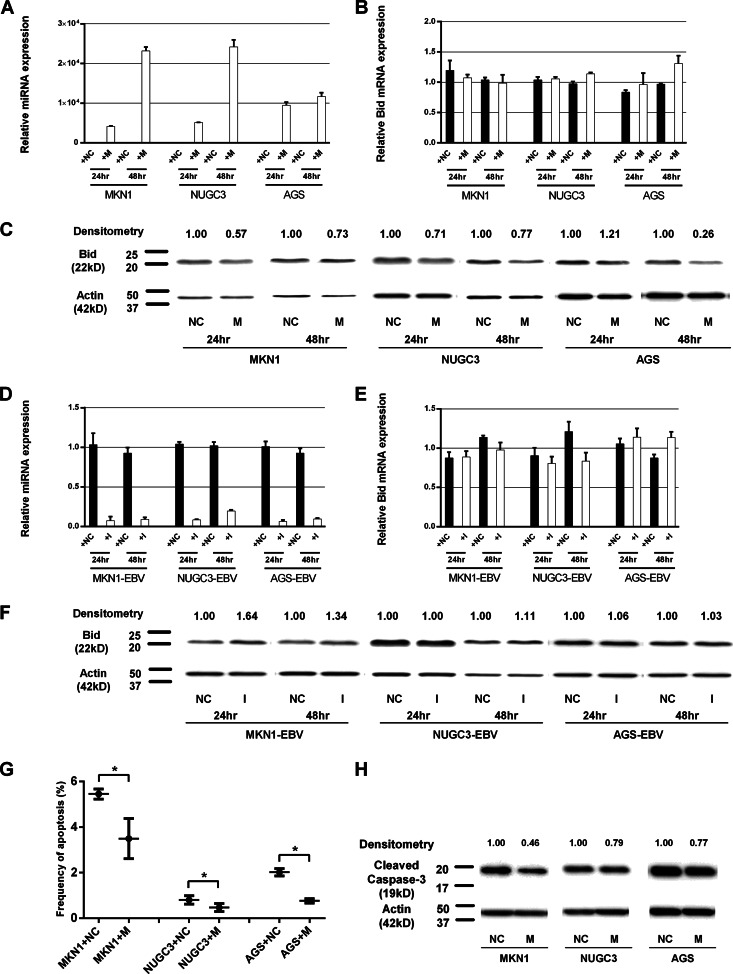
FIG 5.
Effect of ebv-miR-BART4-5p on regulation of Bid protein expression and apoptosis. The results of transfection of the ebv-miR-BART4-5p mimic (A to C) and ebv-miR-BART4-5p inhibitor (D to F) are shown. (A) Quantitative RT-PCR-based analysis of mature ebv-miR-BART4-5p expression levels in EBV-negative cell lines transfected with ebv-miR-BART4-5p mimic and negative-control miRNA (24 h and 48 h posttransfection). Expression of ebv-miR-BART4-5p first was normalized to that of RNU6B and next compared to that of EBV-positive cell lines. (B) Quantitative RT-PCR-based analysis of Bid expression levels. Expression of Bid mRNA first was normalized to that of GAPDH and next compared to that of EBV-negative cell lines. (C) Western blot analysis of Bid expression levels. Expression levels were densitometrically measured. (D) Quantitative RT-PCR-based analysis of mature ebv-miR-BART4-5p expression levels in EBV-positive cell lines transfected with ebv-miR-BART4-5p inhibitor and negative-control miRNA (24 h and 48 h posttransfection). Expression of ebv-miR-BART4-5p first was normalized to that of RNU6B and next compared to that of EBV-positive cell lines. (E) Quantitative RT-PCR-based analysis of Bid expression levels. Expression of Bid mRNA first was normalized to that of GAPDH and next compared to that of EBV-positive cell lines. (F) Western blot analysis of Bid expression levels. Expression levels were densitometrically measured. (G and H) The antiapoptotic effect of ebv-miR-BART4-5p expression in cells under serum-free culture for 48 h. (G) Frequency of apoptotic cells among viable cells. (H) Western blot analysis of cleaved caspase-3. M, ebv-miR-BART4-5p mimic; NC, negative control; I, ebv-miR-BART4-5p inhibitor; *, P < 0.05 (t test).

