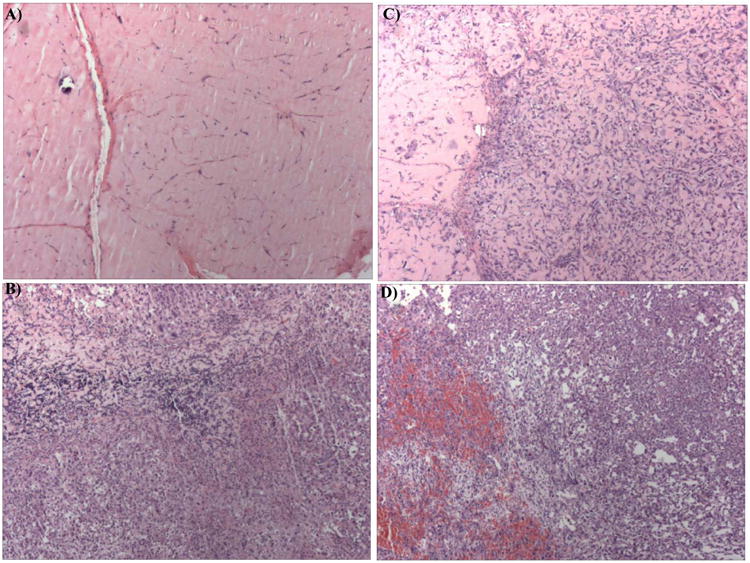
Figure 5.

H&E sections (4×) from a left-flank (irradiated) tumor from an (A) F10-treated animal; and (B) Saline-treated animal. Irradiated tumors from the F10-treated group displayed marked hypocellularity relative to saline-treated animals. (C) H&E section from the right-flank (non-irradiated) tumor from an F10-treated animal and (D) from the right-flank of a saline-treated animal. While animals from both groups were sacrificed based on volumes in the right-flank tumors, tumors from the saline group displayed marked necrosis. Animals from the F10-treated group were sacrificed, on average, 18 days later than animals in the saline group (see Figure 3).
