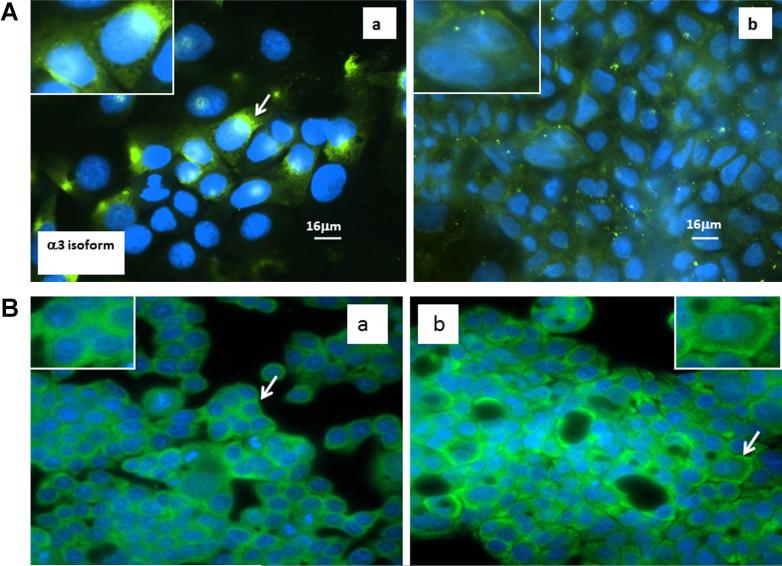
Figure 2.
Distribution of Na+, K+-ATPase α3 isoform in the undifferentiated and differentiated CaCO-2 (A) and HT29 cells (B). Inserts, higher magnification of representative cells. Cells were stained for the presence of α-3 (green) and nuclei (blue). A peri-nuclear location of α-3 subunits is evident in A (a) and B (a) while a more diffuse cytoplasmic location of α-3 is shown in A (b) and B (b).

