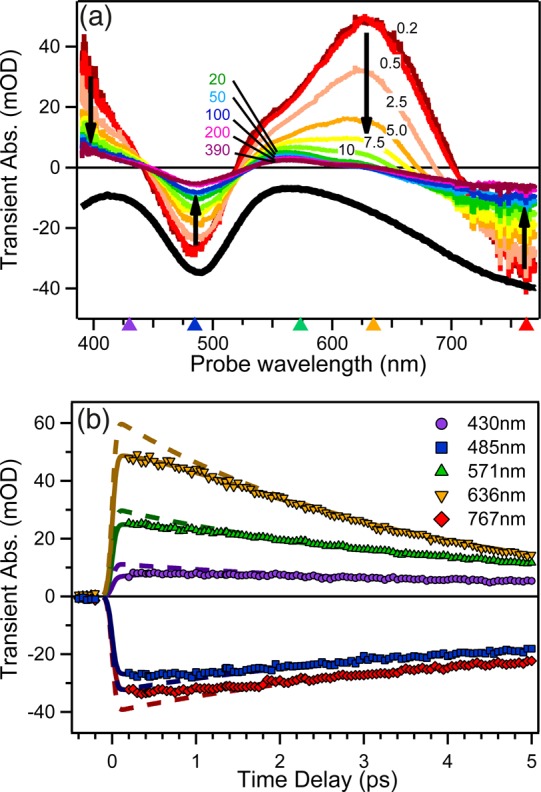
Figure 6.

Representative selection of (a) TA spectra at different time delays and (b) kinetic traces of [Pt(iPr2pipdt)(dmit)] in DMF upon 800 nm excitation. (a) The black curve shows an inverted ground-state absorption spectrum. Black arrows indicate the evolution of the different bands with time. Triangles on the horizontal axis denote the wavelengths of the kinetic traces in panel b. (b) Solid and dashed lines are best fitting curves according to eq 1 and related discussion. Adapted with permission from ref (18). Copyright 2014 The Royal Society of Chemistry.
