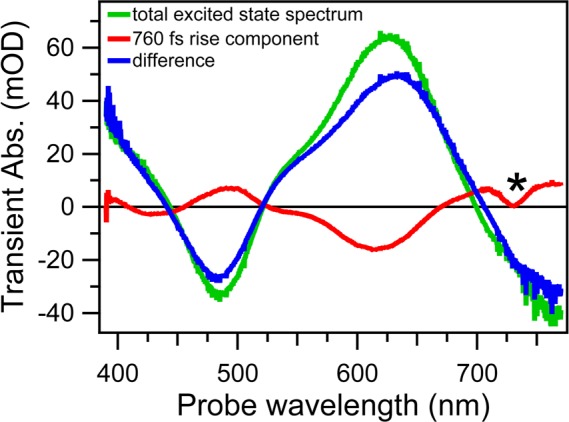
Figure 7.

Decay associated spectra obtained by analysis of TA spectra of [Pt(iPr2pipdt)(dmit)] in DMF representing Aλ,1, the total signal from all the excited molecules after the solvation relaxation (green line); Aλ,rise, the 760 fs rise (red line); and their difference (blue line), which is the signal prior to any solvation. The * indicates an analysis artifact.
