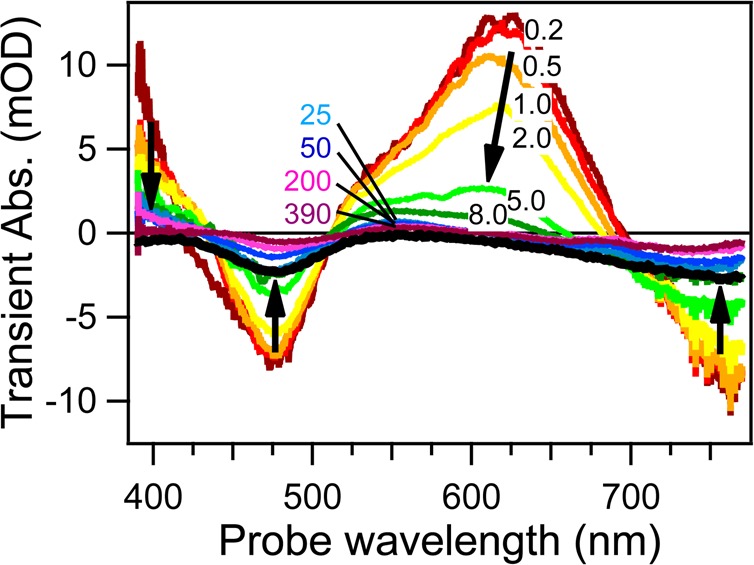
Figure 9.

Representative selection of TA spectra at different time delays of [Pt(iPr2pipdt)(dmit)] in acetonitrile upon 800 nm excitation. The black curve shows an inverted ground-state absorption spectrum. Black arrows indicate the evolution of the different bands with time. Adapted with permission from ref (18). Copyright 2014 The Royal Society of Chemistry.
