
Figure 5.
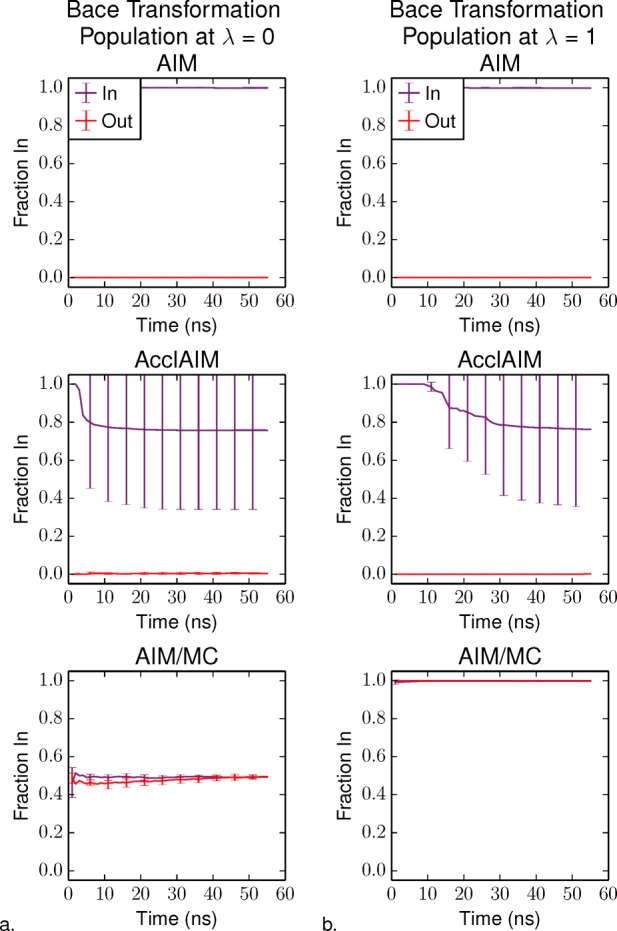
Fraction of the BACE1 ligand ring in the In conformation as a function of simulation time at (a) λ = 0, corresponding to ligand 17a and (b) λ = 1, corresponding to ligand 24. The purple series shows the results for the simulations starting with the In conformation, and the red series shows the results starting with the Out conformation. Error bars represent the standard deviation over four independent trials.