
Figure 1. Neurotensin-regulated microRNAs in colon epithelial cells.
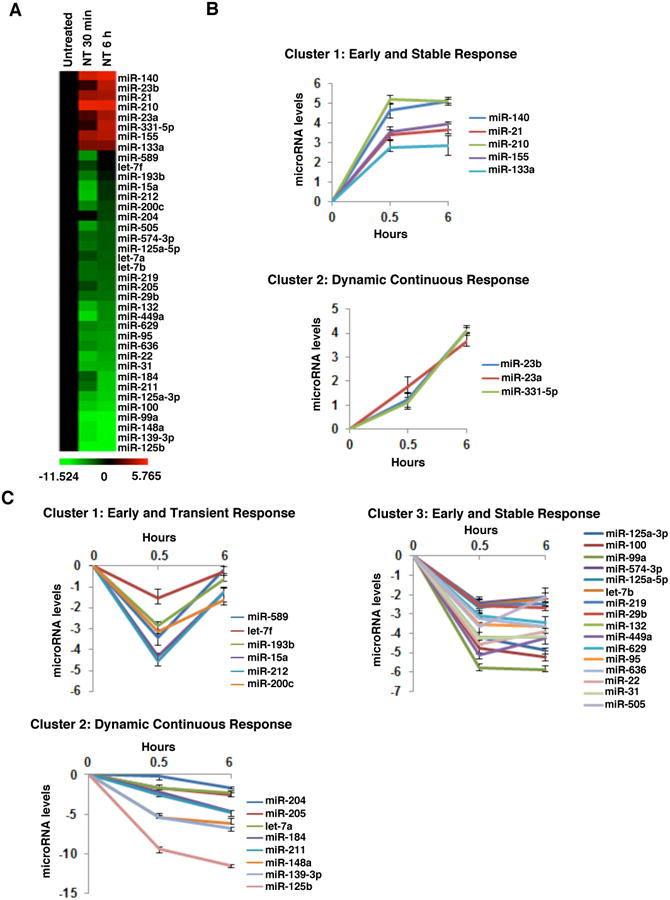
(A) Heatmap representation of differentially expressed microRNAs after NT treatment (0.5, 6h) of NCM460-NTR1 cells. Red: up-regulated microRNAs, green: down-regulated microRNAs. Clustering of NT-induced (B) and NT-suppressed microRNAs (C) according to their response dynamics.