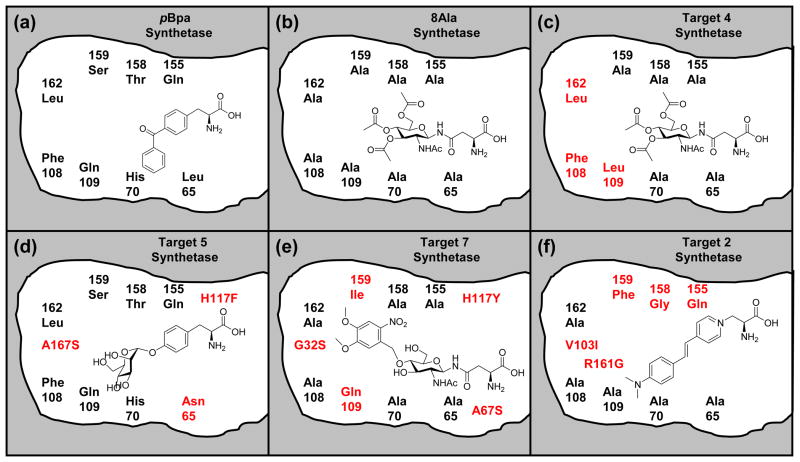
Figure 2.
Cartoon representation of the binding site of pBpa synthetase (A) and designs for target ligands. The position of residues in this cartoon attempt to represent the relative positions of the residues with respect to the peptide binding site and the back of the binding pocket defined by residues L162 and F108. However, proximity of mutations to functional groups shown in the ligands do not necessarily indicate close molecular interactions. In the 8Ala synthetase (B) all of the 8 residues shown were mutated to alanine. The mutations for the best designs for (C) 4, (D) 5, (E) 7, and (F) 2 are shown. The three mutations shown in red in (D) are relative to the pBpa synthetase, and mutations shown in red for (C), (E), and (F) are relative to the 8Ala synthetase.

