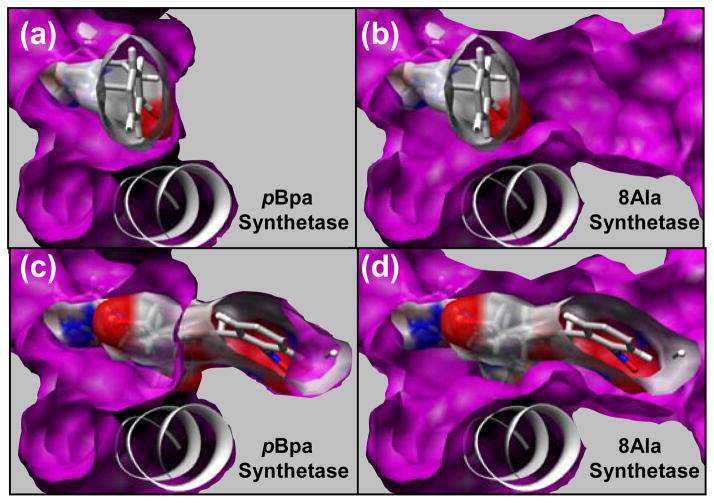
Figure 3.
Comparison of the AA binding site for the pBpa synthetase (A, C) and the 8Ala synthetase (B, D). This view is from the perspective of the back of the binding site (L162, F108) looking towards the peptide binding site in the front of the binding site. Helix (res:150–163) is also shown, which is the predominant secondary structure element defining the bottom of the binding site. Solid gray is shown next to the surface of the binding pocket to indicate that this area is occupied by well packed side chains. The crystallographic conformation of 1 is shown in the AA binding pocket of the pBpa synthetase in (A, C) and in the 8Ala synthetase in (B, D). Surface of the ligand is shown to illustrate the free volume between the surface of the ligand and the binding pocket. The lowest energy conformation of 7 in the AA binding pocket of the 8Ala synthetase is shown in (C, D). The surface of this ligand is shown in (C, D) to illustrate the free volume between the surface of the ligand and the binding pocket. This lowest energy conformation of 7 has significant atom clashes with the surface of the pBpa synthetase, which is shown in (C) where the ligand penetrates into the solid gray area that is occupied by side chains.

