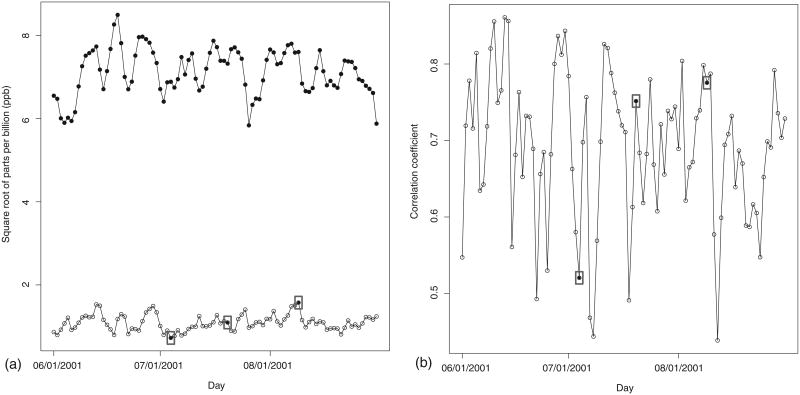
Figure 2.
(a) Daily mean (filled circles) and standard deviation (empty circles) of square root of observed ozone concentration at all the 800 monitoring sites. (b) Daily correlation betweeen square root of observed ozone concentration and square root of CMAQ output of ozone concentration. In both plots, the three days for which we will present results in Section 5 are surrounded by a box. They are, respectively, July 4, July 20, and August 9, 2001.

