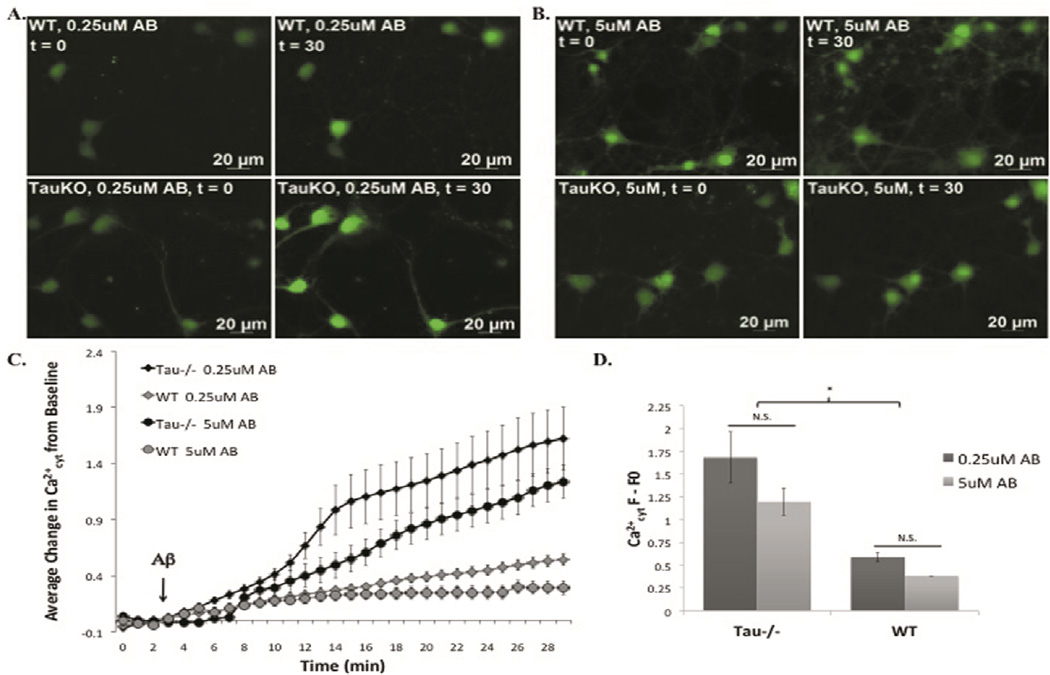
Figure 2. Tau−/− cortical neurons are more susceptible to Aβ42 induced Ca2+cyt increase than WT neurons.
Representative images of t=0 (left) and t=30 (right) for WT (top) and tau−/− (bottom) mouse primary cortical neurons loaded with the Ca2+cyt indicator, fluo4, and treated with 0.25µM (A) and 5µM Aβ42 (B). Full time-lapse experiments (C) and the change from t=0 to t=30 (D) were quantified. *=P<0.05

