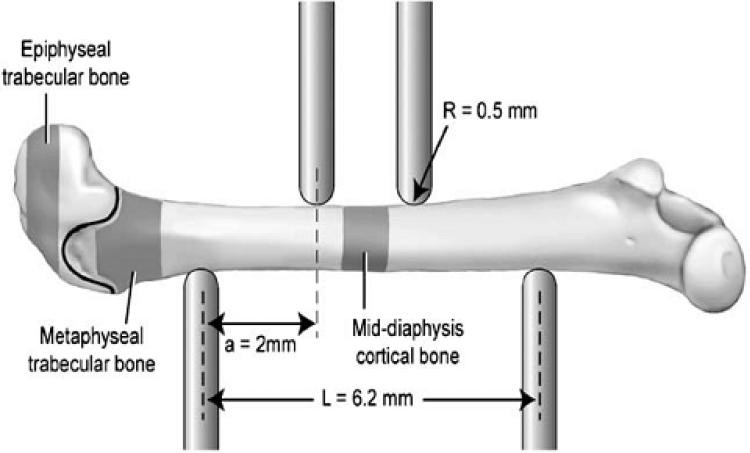
Fig. 1.
Schematic setup of interest point bending and femur placement. The regions of four that were scanned and analyzed by micro- and analyzed by micro CT for morphological assessment are a black highlighted. Location of growth plate between trabecular regions is represented as line. The distance between the two upper points is 2.2 mm (not shown). [Reprinted from Bone, 39/4]. One Column

