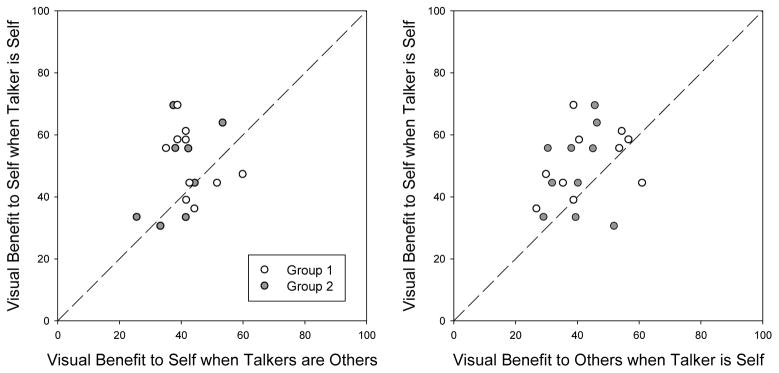
Fig. 1.

Scatterplots comparing participants’ visual speech benefit when they were the talker with the visual benefit when other participants were the talker (left panel) and also with other participants’ visual benefit when they were the talker. Results are shown for members of Group 1 and 2 separately, and as may be seen, despite differences in procedure and the makeup of the groups, similar patterns of results were observed.
