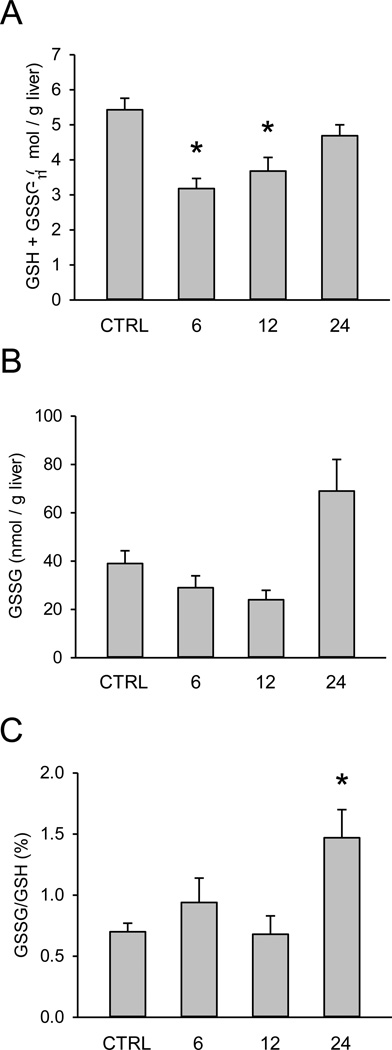
Figure 3.
Time course of total and oxidized glutathione in furosemide-induced liver injury in mice. Mice were treated with 500 mg/kg furosemide (FS) and sacrificed 0, 6, 12, and 24 h later. (A) Total liver glutathione (GSH) levels. (B) Total liver oxidized GSH (GSSG) levels. (C) The percentage of total GSH in the form of GSSG. Data are expressed as mean ± SEM for n = 3–5. *p < 0.05 compared with control.

