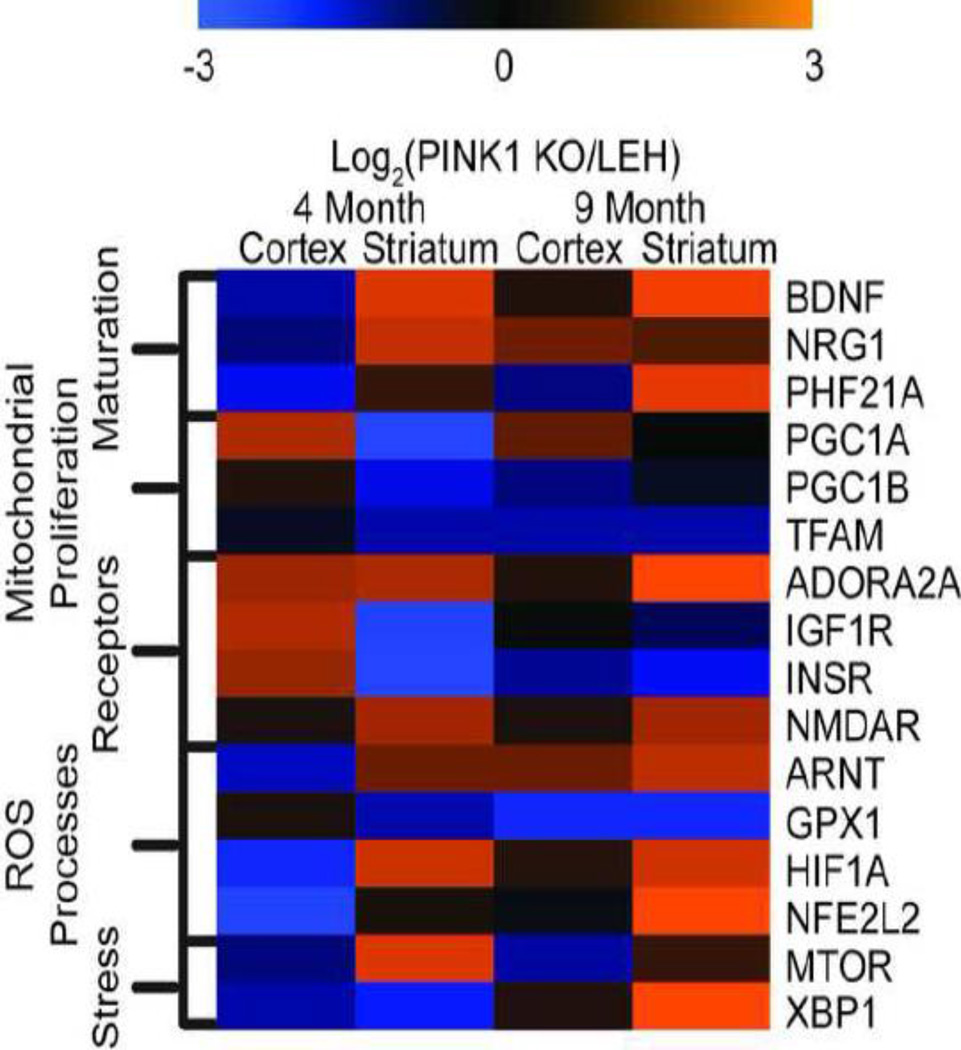
Fig. 6.
IPA predicted activated and deactivated pathways in the PINK1 KO rat model. Data and corresponding expression values were uploaded into the IPA prediction algorithm. Z-score activation was generated and is depicted through the color scale. Upstream regulators were sorted by the cellular processes that each influences. Activation numbers depict level of activation of the PINK1 KO as compared to the LEH control. n=4 for all groups in the analysis.

