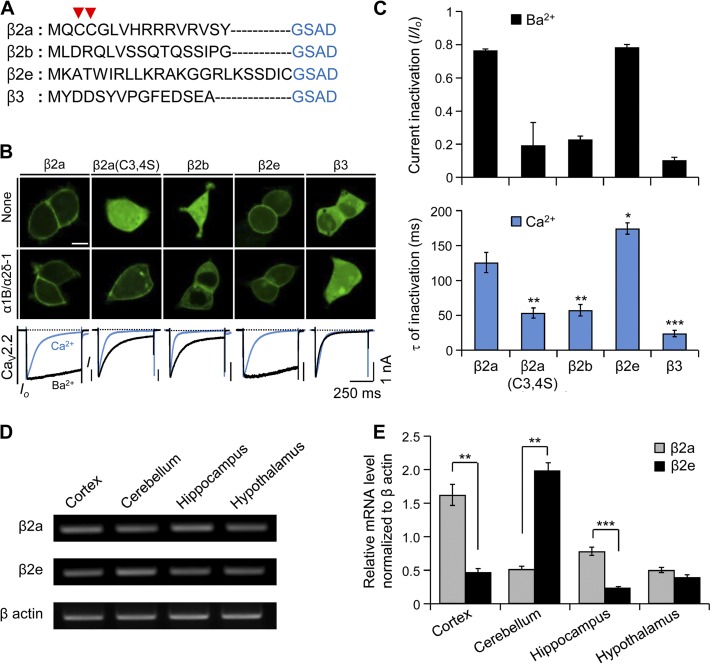
Figure 1.
Subcellular localization of different β subunits in tsA201 cells and mRNA expression of β2a and β2e subunits in brain tissues. (A) Amino acid multi-alignment of the N-terminal region of various β subunits. Arrow heads indicate two cysteine residues responsible for the palmitoylation and membrane binding of the β2a subunit. (B) Confocal images showing subcellular distribution of β subunits in the absence (top) or presence of α1B and α2δ-1 subunits in tsA 201 cells (middle). Current inactivation of CaV2.2 channels with different β subunits (bottom) was recorded during a 500-ms test pulse at 10 mV. Blue and black curves indicate Ca2+ currents and Ba2+ currents, respectively. Bar, 10 µm. (C) Summary of current inactivation of Ba2+ currents (top) and time constant (τ) for current inactivation of Ca2+ currents (bottom). Current inactivation (I/Io) was calculated as current amplitude (I) divided by initial peak amplitude (Io). For Ba2+ currents, β2a (n = 5), β2a(C3,4S) (n = 5), β2b (n = 5), β2e (n = 6), or β3 (n = 6); for Ca2+ currents, β2a (n = 4), β2a(C3,4S) (n = 6), β2b (n = 5), β2e (n = 5), or β3 (n = 5). *, P < 0.05; **, P < 0.01; ***, P < 0.001, compared with β2a. (D) mRNA expression of β2e subunit in cortex, cerebellum, hippocampus, and hypothalamus. mRNA expression of β actin was used as a positive control. (E) qRT-PCR mRNA expression profile for β2e and β2e subunits in cortex (n = 3), cerebellum (n = 3), hippocampus (n = 3), and hypothalamus (n = 3). mRNA expression levels of β2a and β2e subunits were normalized to the mRNA level of β actin. n = 3. **, P < 0.01; ***, P < 0.001, compared with β2a. Data are mean ± SEM.

