Figure 2.
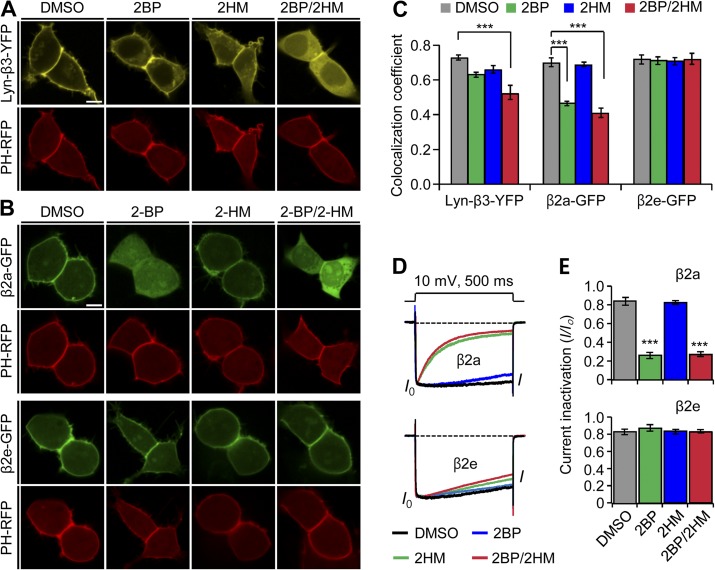
The N-terminal 23 amino acids determine the plasma membrane localization of the β2e subunit. (A) Confocal images of Lyn-β3-YFP–expressed cells. The PIP2 probe PH-PLCδ-RFP (PH-RFP) was cotransfected as a marker of the plasma membrane. Lyn-β3-YFP–expressed cells were preincubated with inhibitors for 12 h after transfection. Confocal images were taken by confocal microscope in the presence of vehicle (0.2% DMSO); a palmitoylation inhibitor, 2-BH (100 µM); a myristoylation inhibitor, 2-HM (100 µM); or both 2-BH and 2-HM. Bar, 5 µm. (B) Effect of lipidation inhibitors on subcellular localization of β2a (top) and β2e subunits (bottom). Cells expressing β2e subunit or β2e subunit were preincubated in the absence or presence of 100 µM 2-BH, 100 µM 2-HM, or both and were imaged by confocal microscope 24 h after transfection. Note that the β2e location was not affected by the inhibitors. Bar, 5 µm. (C) Quantification of membrane localization of Lyn-β3 (n = 8), β2a (n = 10), and β2e (n = 10) subunits compared with PH-RFP. The colocalization coefficients were obtained from merged images of Lyn-β3 and PH-RFP, β2a and PH-RFP, or β2e and PH-RFP, as shown in A and B. ***, P < 0.001, compared with DMSO. (D) Effect of lipidation inhibitors on current inactivation of CaV2.2 channels with β2a (top) or β2e subunits (bottom). Currents were measured during 500-ms test pulses to 10 mV. (E) Summary of current inactivation with β2a (top) and β2e (bottom) subunits. n = 4–6 for β2a; n = 4–5 for β2e. ***, P < 0.001, compared with DMSO. Data are mean ± SEM.

