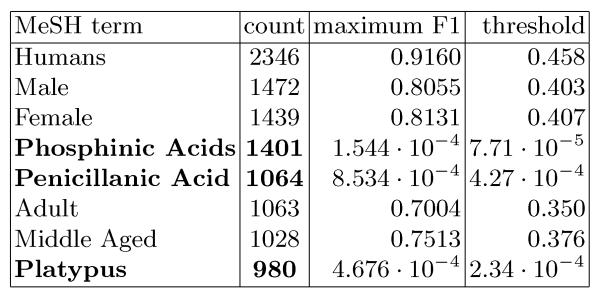
Fig. 7.
Selected frequently predicted MeSH terms. Columns show the term, the number of times it is predicted for a given test set, the empirical maximum achieved F1 measure, and the empirical threshold that achieves this maximum. When F1 is optimized separately for each term, low thresholds are chosen for rare labels (bold) with uninformative classifiers.

