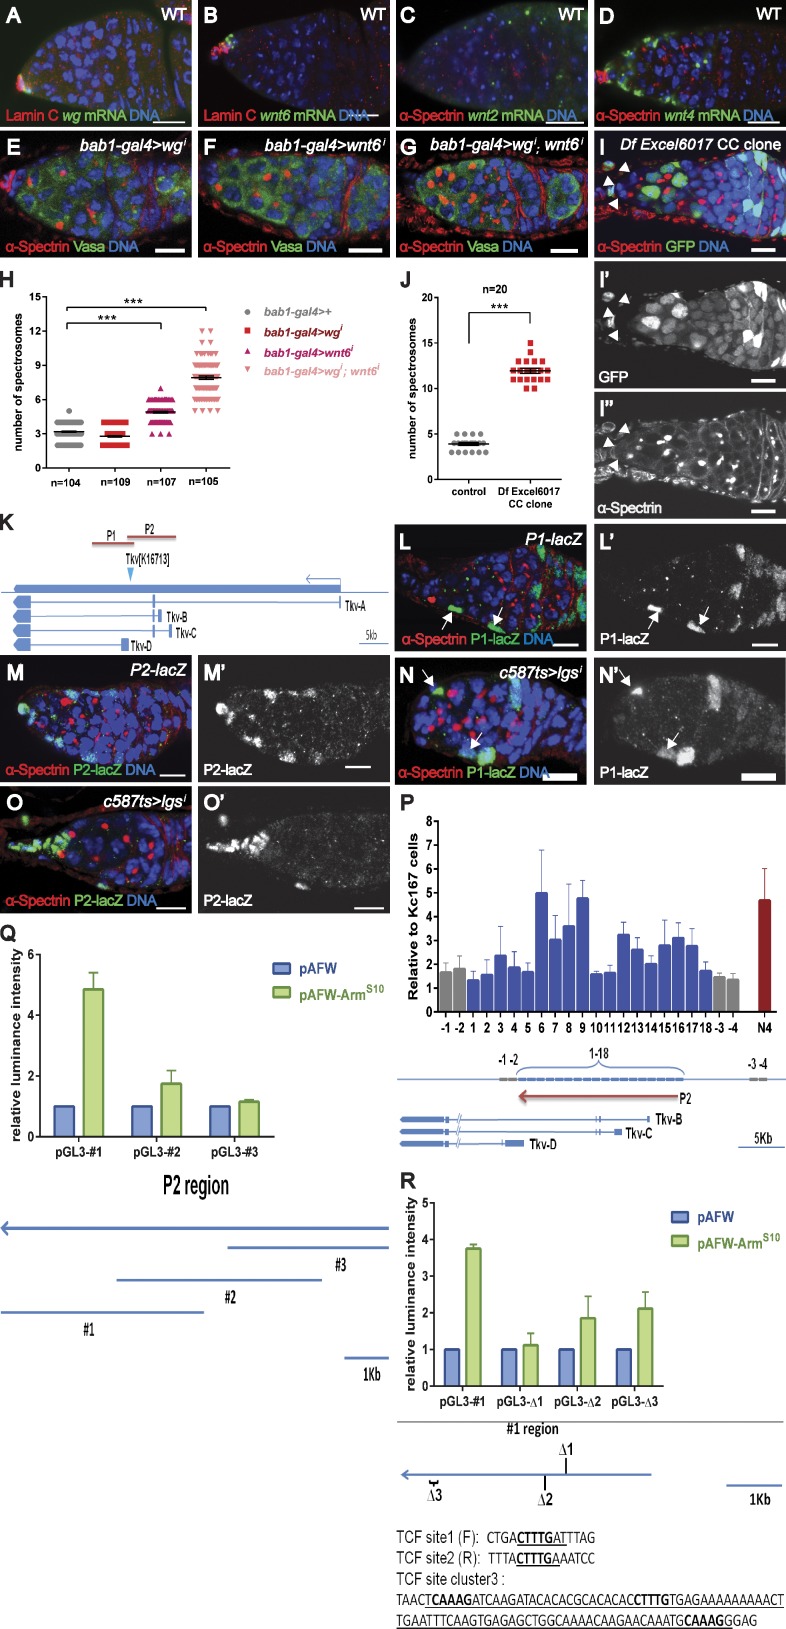
Figure 6.
Cap cell–expressed Wnts promote Tkv expression in ECs. wg (A) and wnt6 (B) transcripts are strongly detected in cap cells (indicated by strong LamC expression). Both wnt2 (C) and wnt4 (D) transcripts are detected in cap cells and ECs. (E–H) Knocking down Wnt6 (F) but not Wg (E) from cap cells results in a slight increase in spectrosome-containing cells, whereas removing both Wg and Wnt6 from cap cells leads to the formation of ectopic spectrosome-containing cells (G and H). (I) A germarium with cap cell mutants (lack of GFP signals marked by arrowheads) for a deficiency removing wg, wnt4, wnt6, and wnt10 contains more spectrosomes. Genotype: FRT40A.ubi-GFP/FRT40A.Df(2L)Excel6017;bab1-gal4.UAS-flp. (J) Statistical data from spectrosome-containing cells in I. (K) A schematic of the genomic region used for the generation of two new transgenic reporters (P1-lacZ and P2-lacZ). (L) P1-lacZ is expressed in several ECs (arrows). (M) P2-lacZ is expressed in most ECs. (N and O) P2-lacZ (O) but not P1-lacZ (N) is down-regulated in the ECs of lgsi (BL-37476) germaria (arrows in N indicate ECs). (P) ChIP experiments in KC167 cells showing that ArmS10 is enriched at the P2 region of the tkv enhancer. Regions 1–18 cover the entire P2 region. Regions −1 to −4 outside the P2 region serve as negative controls, and N4 serves as a positive control (see Materials and methods). (Q) A luciferase assay using dissected fragments of the P2 region shows that fragment #1 responds strongly to ArmS10 overexpression. The dissected fragments (#1 to #3) are shown in the bottom panel. (R) Luciferase assay using different variants of fragment #1 with site1, site2, or site cluster3 deleted (deleted sequence is underlined); bold letters indicate the binding consensus sequence (5′-CTTTG-3′). The luminance intensity is the relative ratio of Firefly/Renilla normalized by the value of related luciferase reporter alone. Error bars represent the SEM. ***, P < 0.001. Bars, 10 µm.

