Fig. 2:

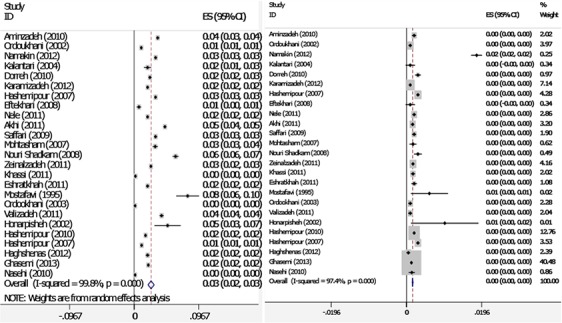
Forest plots of recall rate (A) and incidence of CH (B) for I-squared model meta-analyses (Weights are from I-squared model). The diamond represents the overall result

Forest plots of recall rate (A) and incidence of CH (B) for I-squared model meta-analyses (Weights are from I-squared model). The diamond represents the overall result