Fig. 3.
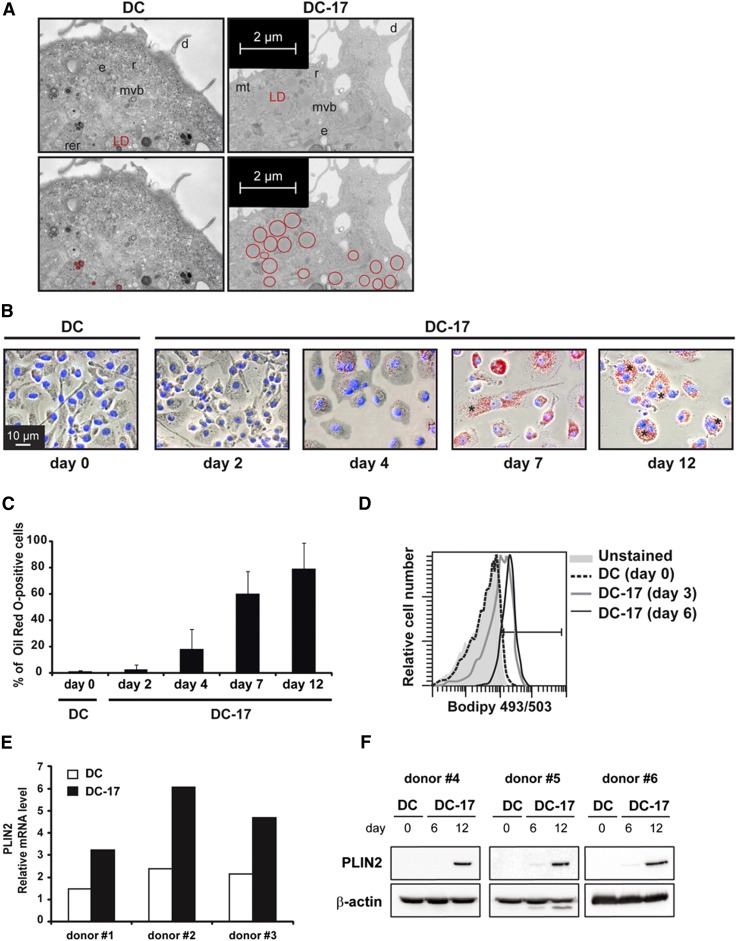
Characterization of LD content in DC-17s. A: Electron microscopy pictures of DCs versus DC-17s following 10 days of treatment with IL-17A. The upper and lower panels represent the same images, with LDs circled in red in the lower ones. d, dendrite; e, endosome; mt, mitochondria; mvb, multivesicular body; r, ribosome area; rer, rough endoplasmic reticulum. Representative of three experiments. B: Representative images of Oil Red O staining from a kinetic study of untreated DCs at day 0 (DC) or DC-17s at indicated time points (DC-17). Red, Oil Red O-positive cells; blue, Hoechst nucleus staining. Representative of five experiments. * indicates binucleated cells. C: Percentage of Oil Red O-positive DCs at day 0 (DC) or at indicated time points during IL-17A treatment of DCs. The bars represent means ± SD of five independent experiments. D: Flow cytometry analysis of untreated DCs at day 0 (DC) or DC-17s, before (Unstained) or after Bodipy staining realized at indicated time points. Representative of three experiments. E: Relative mRNA expression of PLIN2 in DC-17s treated with IL-17A for 12 days compared with untreated DCs from three different donors. mRNAs were quantified by RT-qPCR. F: Western blot analysis of PLIN2 (48 kDa) in untreated DCs at day 0 (DC) or DC-17s treated with IL-17A for 6 and 12 days on three independent donors. β-actin (45 kDa) was used as a loading control.

