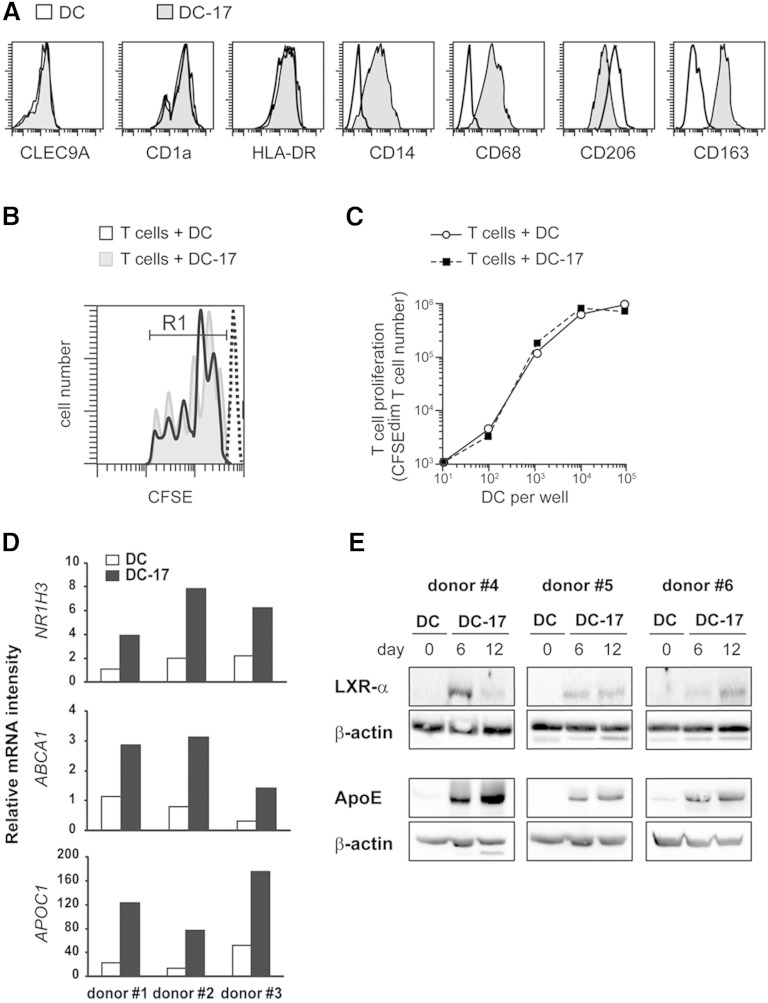
Fig. 5.
Analyses of phenotype, specific genetic program, and immunogenicity of DC-17s. A: Flow cytometry analysis of the expression of CLEC9A, CD1a, HLA-DR, CD14, CD68, CD206, and CD163 in DCs and after 6 days of culture with IL-17A. Representative of n > 5 experiments. B, C: Untreated DCs versus DC-17s treated with IL-17A for 5 days were cultured for 5 additional days in the presence of CFSE-labeled T cells purified from allogeneic donors. At day 5, the decrease of CFSE fluorescence in T cells was measured by flow cytometry and compared with parental CFSE+ T cells at day 0 (dashed line). B: Individualized pics for each cell division are shown. C: The number of CFSE-diminished T cells represents the progeny of CFSE+ T cells, in the presence of increased number of allogeneic DC. Results are those of one experiment representative of two. D: Relative mRNA expression of NR1H3, ABCA1, and APOC1 in DC-17s treated with IL-17A for 12 days compared with untreated DCs at day 0 from three different donors. mRNAs were quantified by RT-qPCR. E: Western blot analysis of LXR-α (from NR1H3 gene, 50 kDa) and APOE (38 kDa) in untreated DCs at day 0 or DC-17s treated with IL-17A for 6 and 12 days on three independent donors. β-actin (45 kDa) was used as a loading control.

