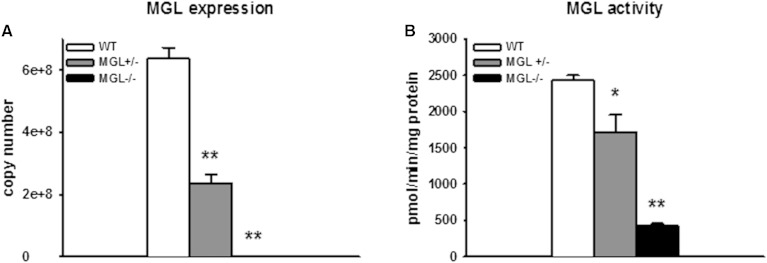
Fig. 1.
Absence of MGL expression and function in MGL−/− mice A: Quantitative PCR of MGL transcript in brain. B: MGL activity determined by [3H]2-AG hydrolysis to 2-AG and glycerol in whole brain homogenates. Data are expressed as average ± SEM (n = 4–6). *P < 0.01, **P < 0.001 compared MGL+/+ (WT).

