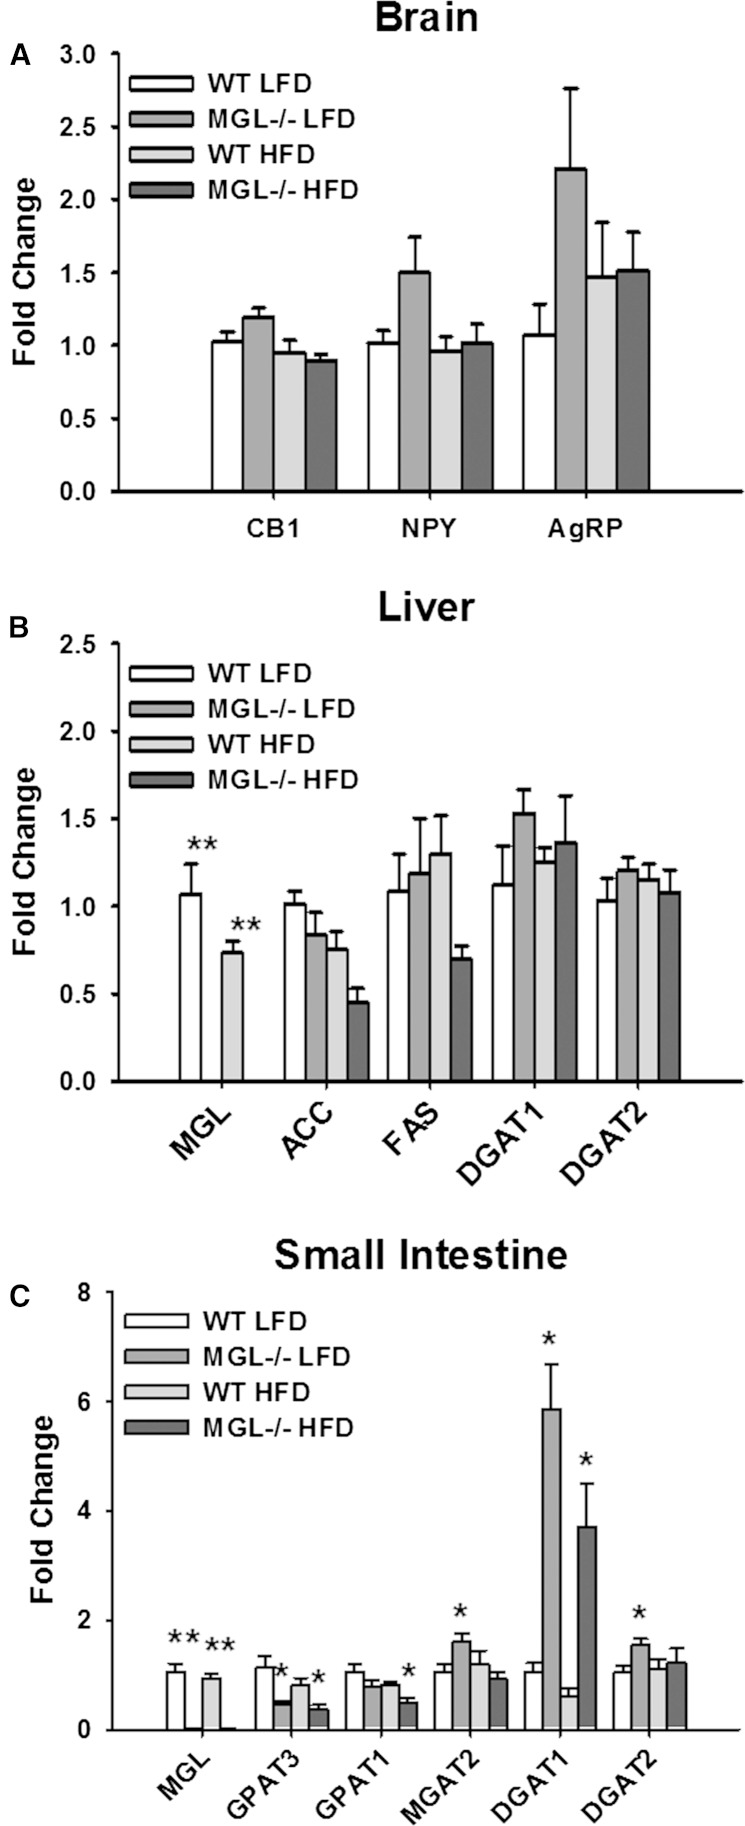
Fig. 11.
Tissue gene expression measured by RT-PCR and analyzed by the ddCT method in brain (A), liver (B), and small intestine mucosa (C). All transcript levels are presented relative to the WT LFD group. Data are expressed as average ± SEM (n = 5–6). *P < 0.05, **P < 0.001 compared with control group of the same diet.

