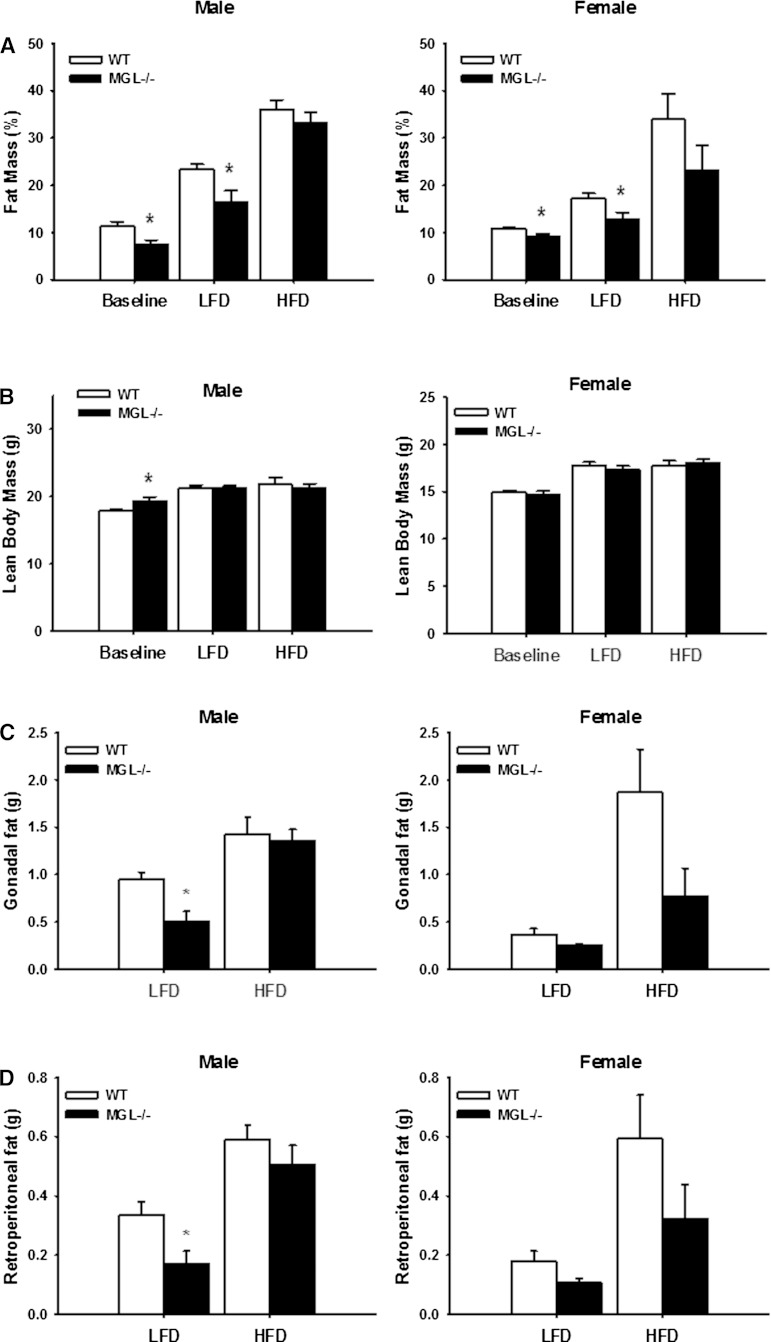
Fig. 5.
Body composition and tissue weights in MGL−/− mice. A: Fat mass percentage for male and female mice at the beginning (baseline) and after 10 weeks of diet. B: Lean body mass at the beginning (baseline) and end of study. Gonadal (C) and retroperitoneal (perirenal) (D) fat pad weights at necropsy. Data are expressed as average ± SEM (n = 6). *P < 0.05 compared with control group of the same diet.

