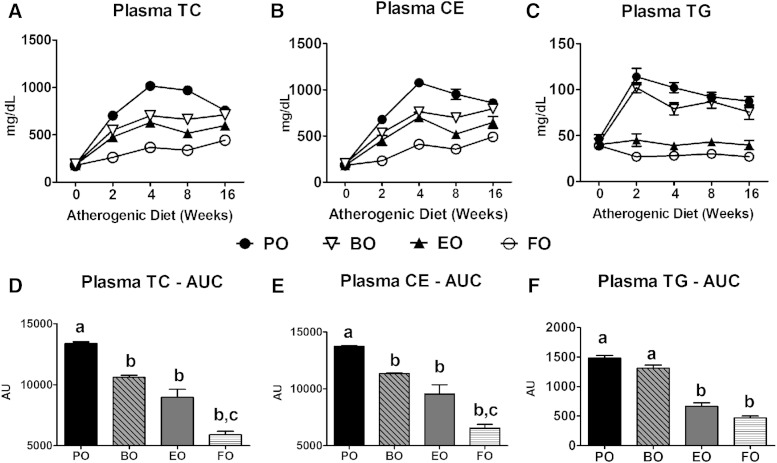
Fig. 4.
Plasma lipid concentrations. Fasting (4 h) plasma TC (A), CE (B), and TG (C) concentrations in LDLrKO mice during a 16 week AD feeding were measured by enzymatic assays (n = 15). CE = (TC − FC) × 1.67. Plasma TC, CE, and TG concentrations were integrated over the 16 week study and expressed as AUC (D–F). Data are expressed as mean ± SEM, n = 15 per diet. Groups with different letters are significantly different (P < 0.05) by one-way ANOVA and Tukey’s post hoc analysis.

