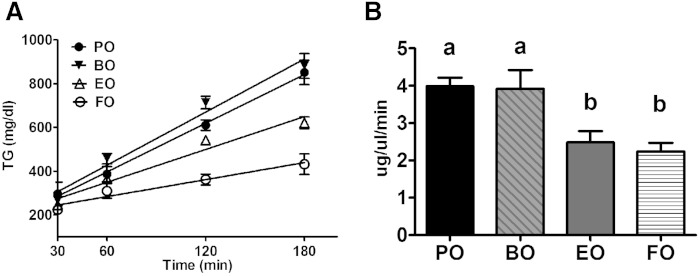
Fig. 6.
Hepatic VLDL-TG secretion rate. A: Plasma TG levels were measured by enzymatic assay before (0 min) and after (60, 120, and 180 min) intravenous Triton® injection. B: Hepatic TG secretion rate during the 3 h experiment was calculated for each animal as the slope of the regression line. Data are plotted as mean ± SEM, n = 4–5. Groups with different letters are significantly different (P < 0.05) by one-way ANOVA and Tukey’s post hoc analysis.

