Fig. 6.
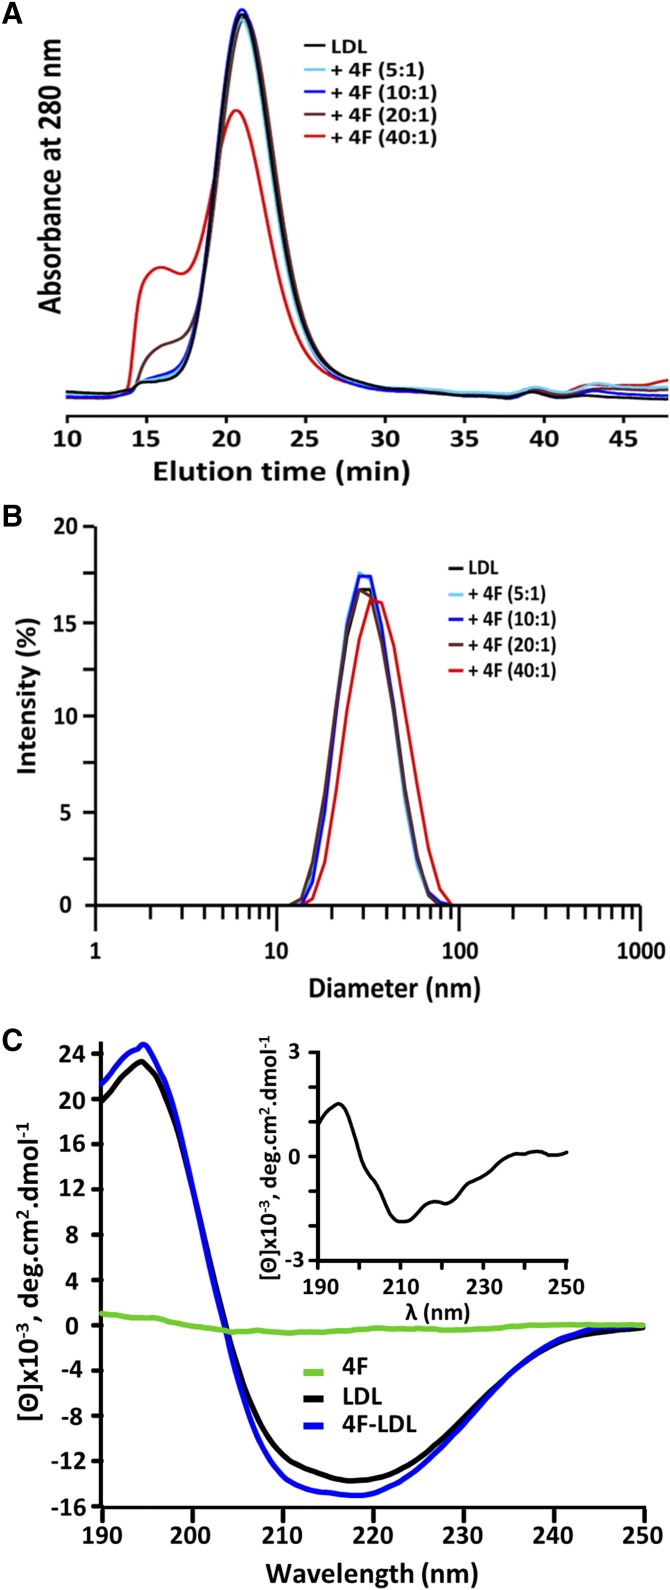
The effect of 4F on LDL structure. LDL particles (1 mg/ml) were incubated with and without L-4F at the indicated molar ratios of 4F:apoB-100 at pH 7.0 for 30 min. The structure of LDL was analyzed by SEC (A), and the sizes of the LDL particles were measured using DLS (B). LDL (2 mg/ml) was preincubated with and without L-4F at molar ratio of 4F:apoB-100 (10:1), followed by extensive dialysis. The control and 4F-pretreated LDL were diluted to (50 µg/ml) for far UV-CD measurement (C). The inset in C shows the spectrum difference between 4F-pretreated LDL and LDL: [Θ] 4F-pretreated LDL − [Θ] LDL. The green curve indicates the CD signal of the same L-4F concentration that was preincubated in buffer alone and directly diluted without dialysis for CD measurement. The results are representative of three independent experiments performed with different LDL preparations.

