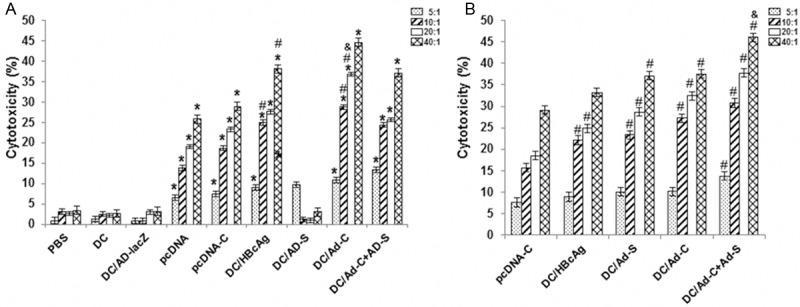
Figure 5.

HBcAg-specific cytotoxic T lymphocyte (CTL) activity assessment. HBcAg-specific CTL activities were measured at 2 w (A) or 4 w (B) after vaccination, with various effector/target (E/T) ratios. Compared with the DC/Ad-lacZ group, *P < 0.05; compared with the pcDNA-C group, #P < 0.05; compared with the DC/HBcAg group, &P < 0.05; compared with the DC/Ad-S and DC/Ad-C groups, $P < 0.05.
