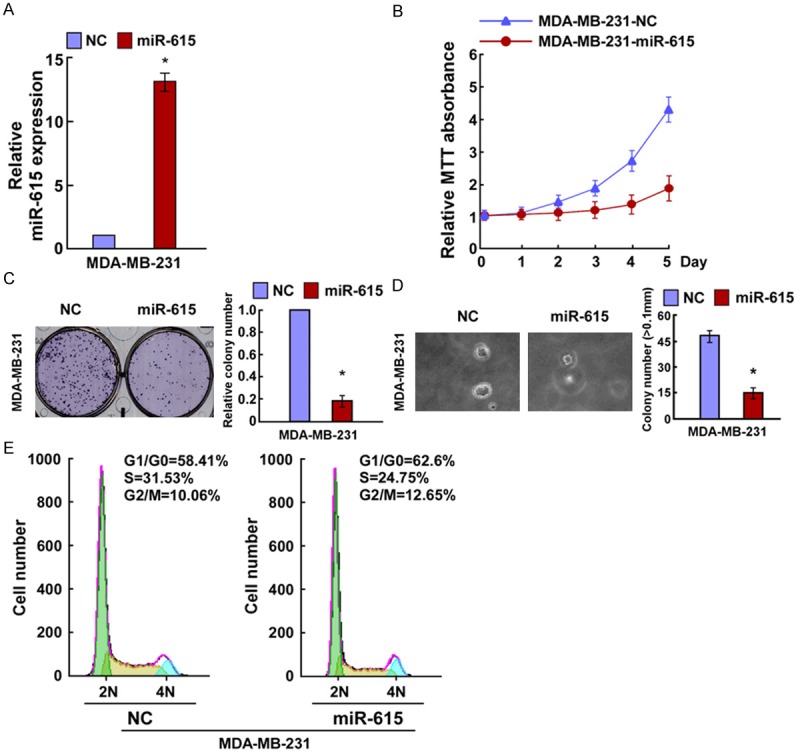
Figure 2.

miR-615 upregulation inhibited bre-ast cancer cell proliferation. A. Validation of miR-615 expression levels after transfection by PCR analysis. B. MTT assays revealed that upregulation of miR-615 suppressed growth of MDA-MB231 cells. C. Representative micrographs (left) and quantification (right) of crystal violet-stained cell colonies. D. Upregulation of miR-615 inhibited the anchorage-independent growth of MDA-MB2310 cells. Representative micrographs (left) and quantification of colonies that were > 0.1 mm (right). E. Flow cytometric analysis of the indicated MDA-MB231 cells transfected with NC or miR-615. Each bar represents the mean of three independent experiments. *P < 0.05.
