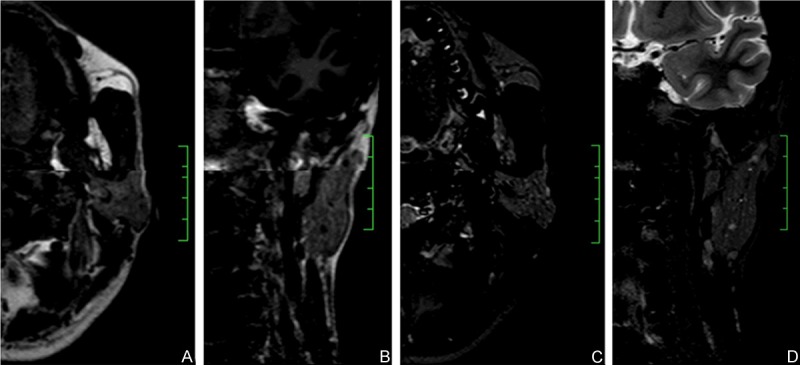
Figure 1.

Fat signal grading’s on MRI images. Images were from same patient with Sjögren syndrome, fat signal grade 2. (A and B) were representative axial and coronal MR images showing heterogeneous signal distribution within parotid gland, with diffusive honeycomb-like fat signals which intensity was comparable with subcutaneous fat tissue. (C and D) were axial and coronal STIR images. The high-intensity signals observed on the T1-weighted images of the parotid glands were converted into decreased signal at corresponding areas. Some sporadic high-intensity signals indicated dilated peripheral ducts.
