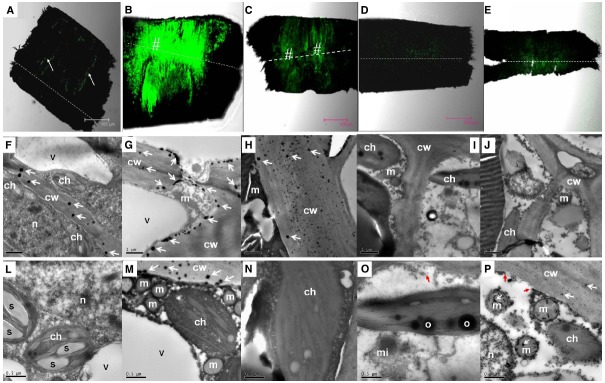
FIGURE 4.

Changes in the distribution of H2O2 as revealed by DCF fluorescence under a confocal scanning microscope in the pedicel (A–E) and by CeCl3 precipitation in the abscission zone under a transmission electron microscope (F–P) after girdling plus defoliation treatment. A,F,L: samples at day 0 (control), with occurrence of H2O2 that was more concentrated in the cambium (arrow in A) and exclusively located in the cell walls (arrows in F); B,G,M: samples of 1 day after treatment (DAT). Note increase in fluorescence yield compared with that at Day 0 (B vs A) and apoplastic location of H2O2 along the plasma membrane (arrows) and the cell walls (arrows in G and M). C,H,N: samples of 2 DAT. Note fluorescence reduced compared with 1 DAT (C vs B) and H2O2 occurred exclusively in the cell walls (arrows in H). D,I,O: samples of 3 DAT, with fluorescence weaker than in the earlier samples and no observable occurrence of H2O2 in the cell walls and other cell parts. Note apparent breakdown of cytoplasm and plasma membrane (red arrow in O). E,J,P: samples of 4 DAT, with reappearance of H2O2 in the cell walls and mitochondria (white arrows in P) and breakdown of plasma membrane (red arrows in P). Dashed lines indicate the abscission layer. The symbol “#” indicates the abscission zone with relatively high H2O2. cw, cell wall; ch, chloroplast; m, mitochondrion; mi, microsome; n, nuclear; o, oil drop in chloroplast; s, starch grains in chloroplasts; v, vacuole.
