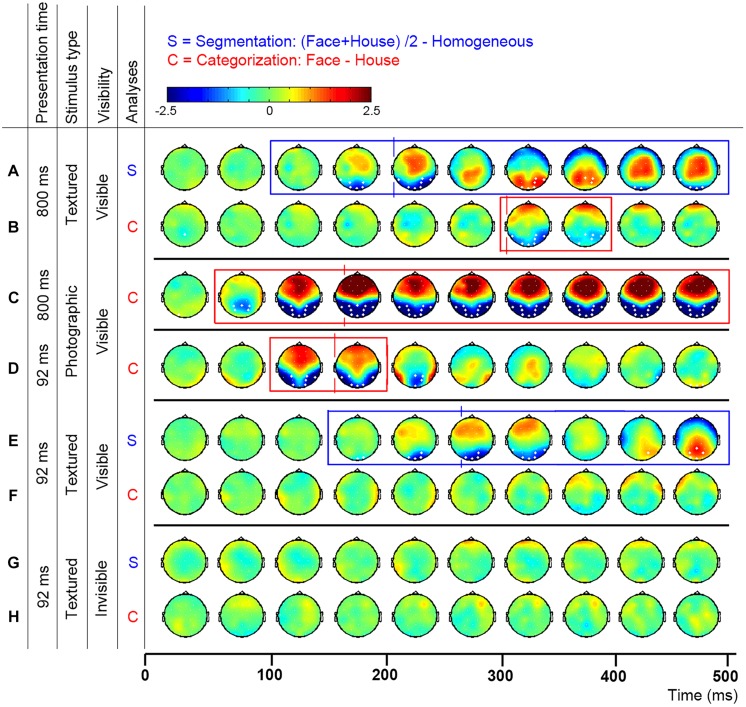
FIGURE 2.
Topographic distribution of evoked activity in time-bins of 50 ms, resulting from segmentation-related (S) and category-selective (C) contrasts. Thick white electrodes indicate cluster-corrected significant sites. Rectangles indicate cluster-corrected significant time-bins. Vertical lines indicate the timepoint at which activity was maximal, revealed by ERP peak-detection of segmentation-related activity at the Oz and category-selective responses at the P8 electrode. Activity was evoked by various stimulus and presentation settings (described on the left): Experiment 1, texture-defined objects presented for 800 ms evoked segmentation-related activity (A) and category-selective responses (B); Experiment 2, photographic objects presented for 800 ms evoked category-selective responses (C); Experiment 3, photographic objects presented for 92 ms evoked category-selective responses (D); Experiment 4, texture-defined objects presented for 92 ms evoked in the visible condition segmentation-related activity (E) but no category-selective responses (F), and in the invisible condition no segmentation-related activity (G) or category-selective responses (H).

