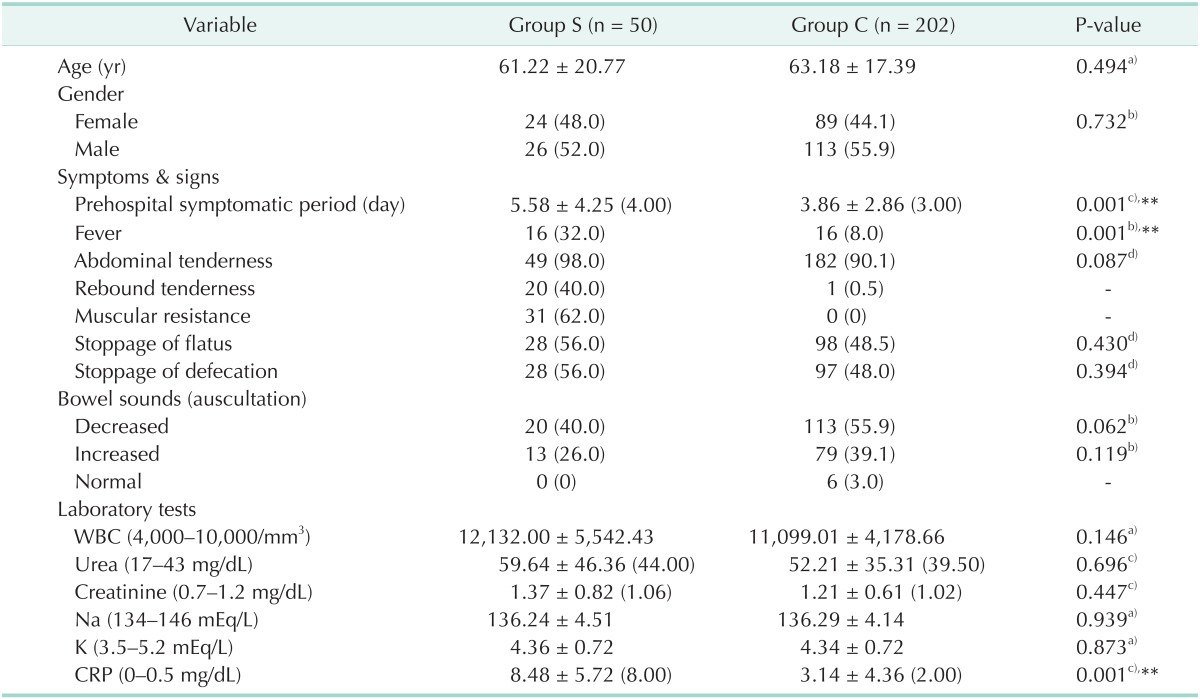
Table 1. Comparison of the demographic data, symptoms & signs, and laboratory tests between two different treatment modality groups.

Values are presented as mean ± standard deviation (median) or number (%).
Group S, operative treatment group; group C, nonoperative treatment group.
a)Student t-test. b)Yates' contiunity correction. c)Mann-Whitney U test. d)Fisher exact test. **P < 0.01.
