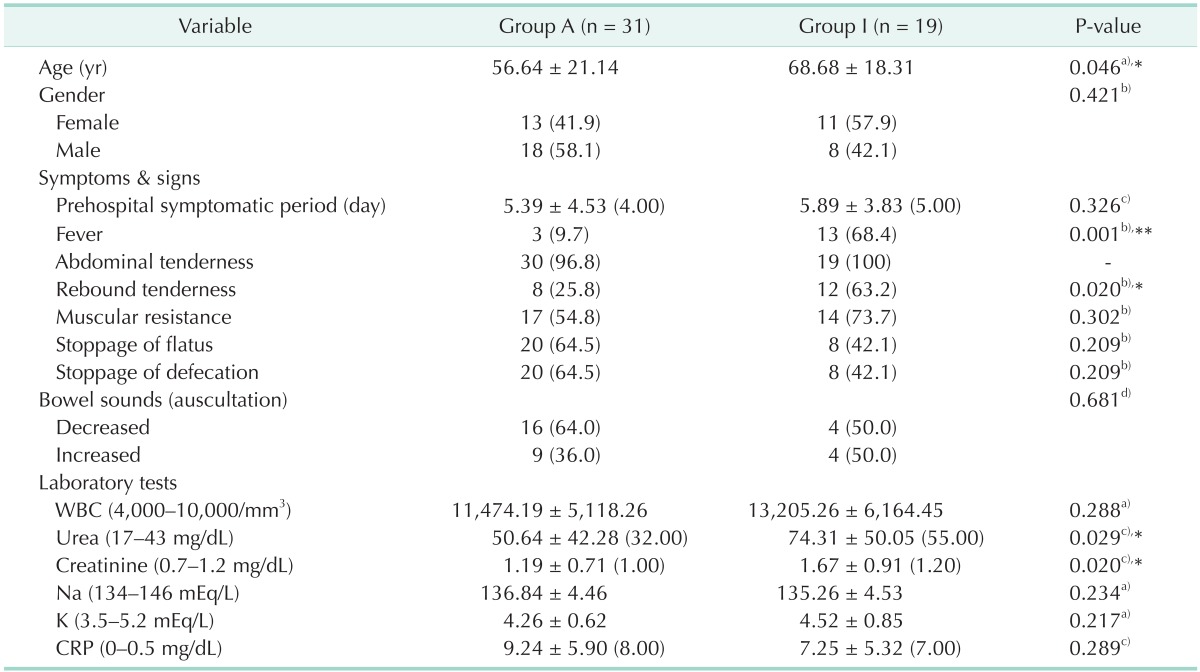
Table 4. Comparison of the demographic data, symptoms & signs, and laboratory tests between groups A and I.

Values are presented as mean ± standard deviation (median) or number (%).
Group A, adhesion only group; group I, bowel ischemia group.
a)Student t-test. b)Yates' continuity correction. c)Mann-Whitney U test. d)Fisher exact test. *P < 0.05. **P < 0.01.
