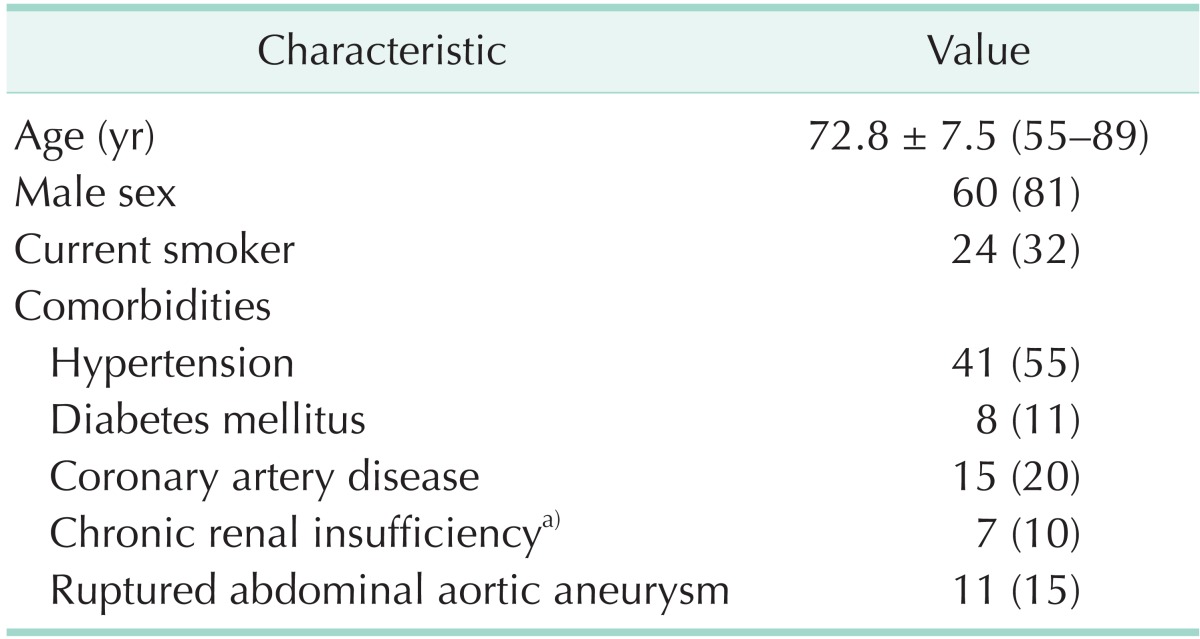
Table 2. Patient demographic data (n = 74).

Values are presented as mean ± standard deviation (range) or number (%).
a)Serum creatinine level > 1.5 mg/dL.

Values are presented as mean ± standard deviation (range) or number (%).
a)Serum creatinine level > 1.5 mg/dL.