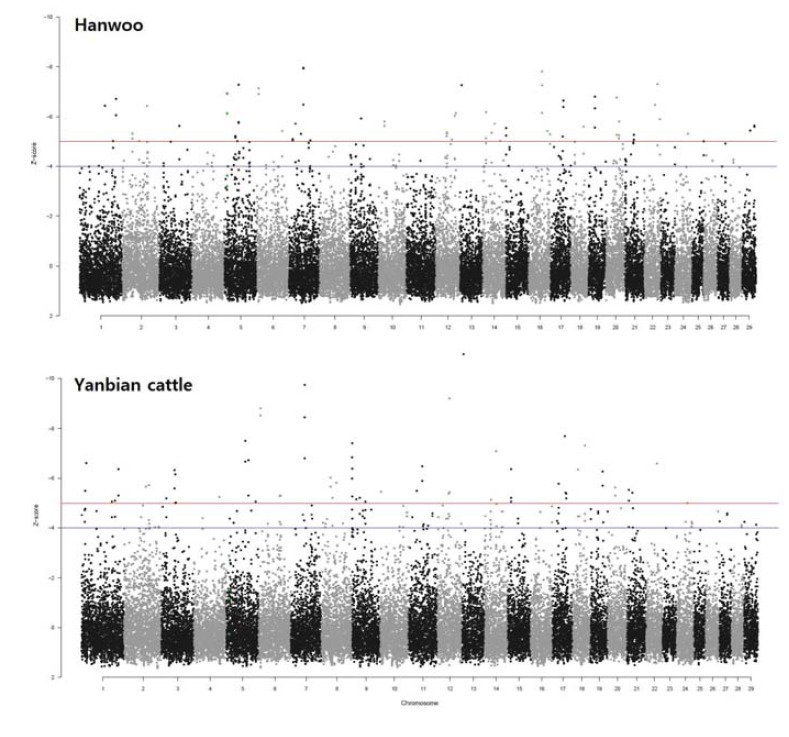
Fig. 3.

Distribution of ZHp scores across all 29 Bos taurus autosomes for HAN and YAN. The upper and lower plots indicate the ZHp score distribution of Hanwoo and Yanbian cattle, respectively. Even numbered chromosomes are presented in gray and odd numbered chromosomes are black. The blue and red horizontal lines indicate ZHp thresholds of −4 and −5 that could be strong candidates of selective sweeps in this study.
