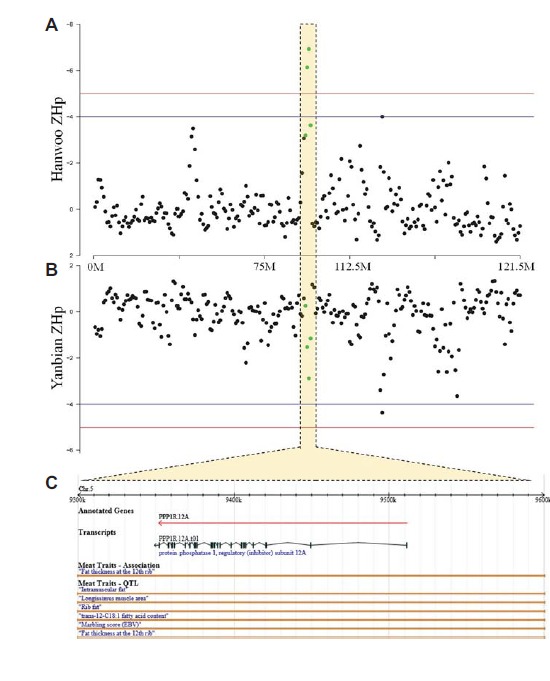
Fig. 4.

A putative selective sweep at the PPP1R12A locus in Hanwoo. (A) and (B) present the Z score of the pooled heterozygosity (ZHp) plot for Hanwoo and Yanbian cattle, respectively. The red and blue horizontal lines in these plots indicate ZHp scores of −5 and −4, respectively. Each circle-point represents ZHp score in each window used in this study. The yellow-highlighted marks the vicinity of the sweep including the PPP1R12A gene. ZHp scores in the interval were indicated as a green color. (C) The annotated gene structure of the PPP1R12A gene as well as underlying QTLs for the genomic region as visualized using the Animal QTLdb.
