
Figure 3.
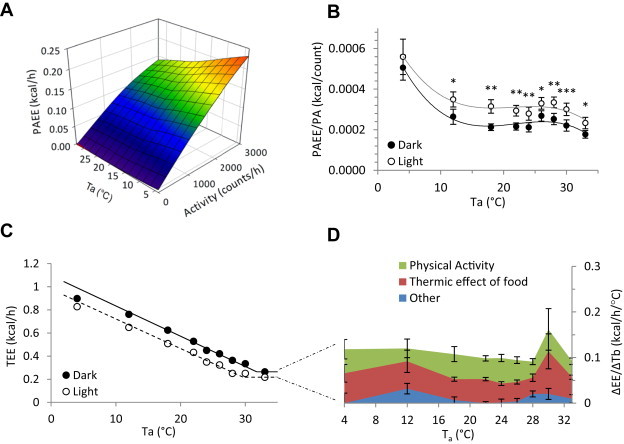
Energy cost of physical activity and of the dark phase. A. Energy cost of physical activity at various environmental temperatures during the light phase. PAEE = 0.0470 − (0.000973 * Ta) + (0.0000381 * activity); SE are 0.00272, 0.000111, and 0.000000730, respectively, adjusted R2 = 0.57. B. Mean light and dark phase apparent PAEE normalized for activity, illustrating the consistently higher normalized cost during the light phase and at Ta = 4 °C (*, p < 0.05; **, p < 0.01; ***, p < 0.001). C. Light and dark phase TEE. D. Cost of maintaining the warmer dark phase Tb. The Y axis is the difference in TEE of the dark and light phases, divided by the differences in mean Tb of the dark and light phases. The EE is attributed to PAEE (green), TEF (red), and residual (blue). Data are mean ± SEM, n = 11, chow-fed male C57BL/6J mice (in C the error bars fall within the symbols).