FIGURE 2.

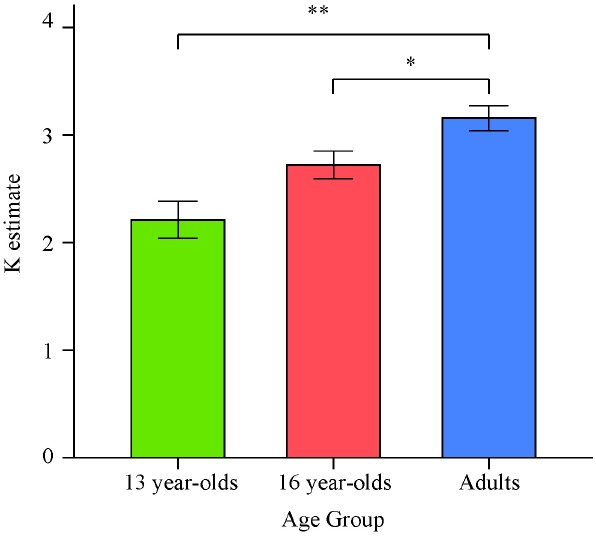
Means and standard errors of the average VWM capacity (K) estimates computed based on set sizes 4 and 6 for the three age groups in Experiment 1. *p < 0.05; **p < 0.001.

Means and standard errors of the average VWM capacity (K) estimates computed based on set sizes 4 and 6 for the three age groups in Experiment 1. *p < 0.05; **p < 0.001.