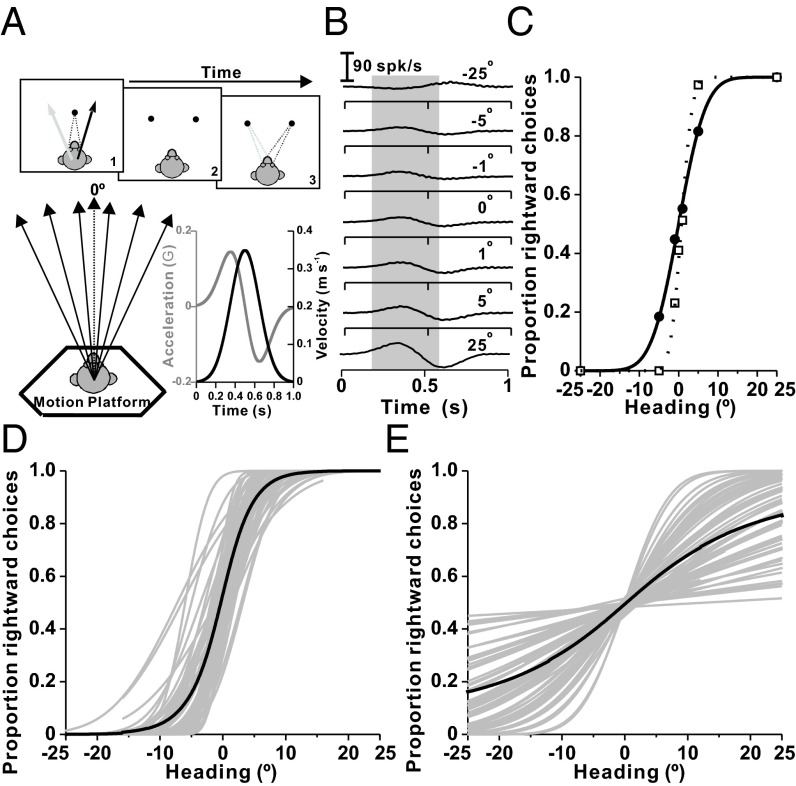
Fig. 1.
Behavioral task, neural analysis, and summary of neuronal and psychophysical performance. (A) Layout of the heading discrimination task and illustration of the Gaussian stimulus velocity (black) and biphasic linear acceleration (gray) profiles. (B) Peri-stimulus time histograms (PSTHs) of responses corresponding to seven distinct headings (top to bottom: −25°, −5°, −1°, 0°, −1°, −5°, and −25°) for an example neuron. Responses in a 400-ms window centered on peak acceleration (gray shading) were monotonically tuned (Fig. S1D). (C) Neurometric function (● and solid curve) for the same neuron showing the proportion of “rightward” decisions for an ideal observer as a function of heading. The corresponding psychometric function fit is also shown (□). (D) Individual (gray curves) and mean (black curve) psychometric functions are shown as cumulative Gaussian fits (n = 54 sessions). (E) Individual (gray curves) and mean (black curve) neurometric functions (cumulative Gaussian fits to ROC data from n = 62 otolith afferent fibers). With the exception of eight fibers, all primary otolith afferent data were recorded while trained animals performed the discrimination task.

