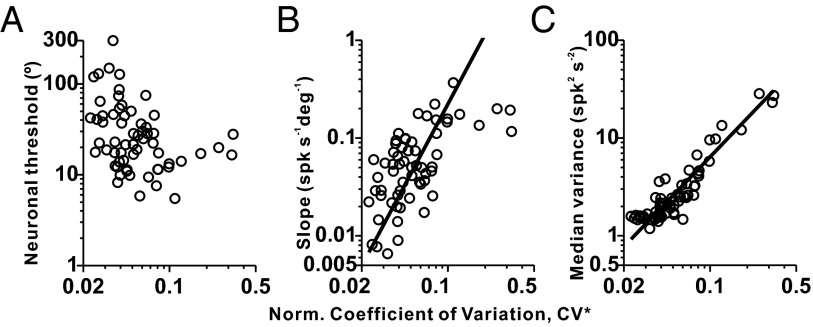
Fig. 3.
Dependence of neuronal sensitivity on discharge regularity. Scatter plots show the neuronal threshold (A), tuning curve slope (B), and median response variance (C) plotted against CV* (n = 62 afferents). Median response variance is computed across all headings tested in the discrimination task. Solid lines illustrate type II linear regression fits (shown only for significant correlations).

