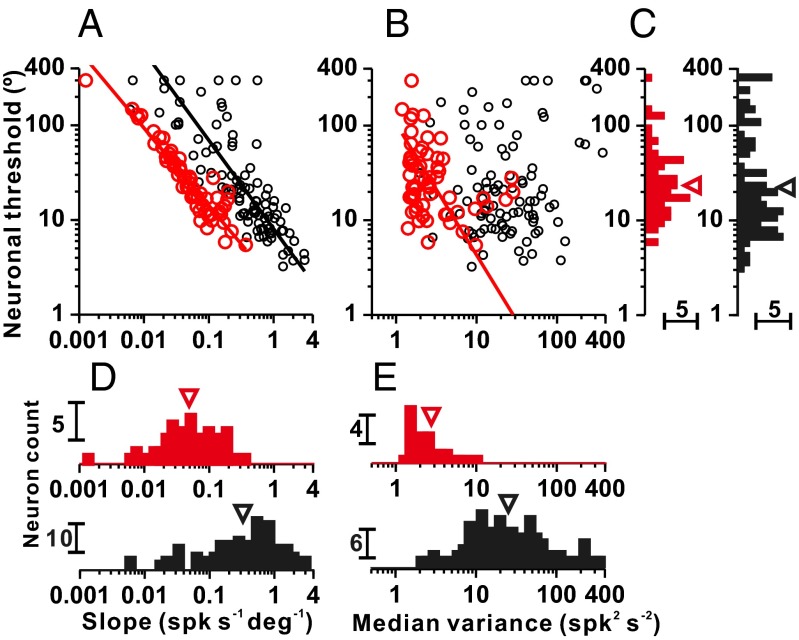
Fig. 4.
Comparison between otolith afferents and central VN/CN cells. Scatter plots of neuronal threshold vs. tuning curve slope (A) and median response variance (B) for otolith afferents (red symbols, n = 64) and VN/CN neurons (black symbols, n = 97; data from ref. 13). Solid lines show type II linear regression fits (plotted only for significant correlations). Marginal distributions of neuronal threshold (C), tuning curve slope (D), and median response variance (E) are shown. Arrowheads illustrate geometric means. spk, spike.

