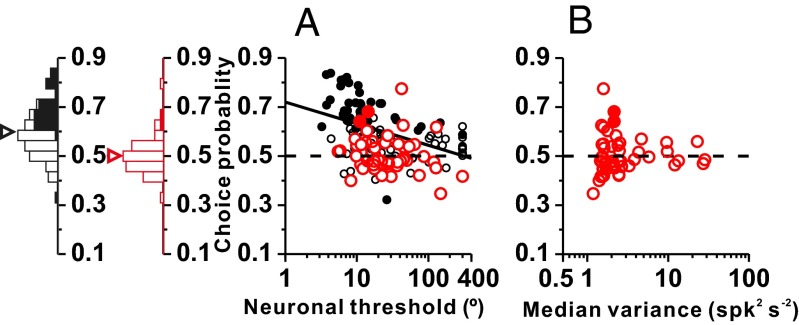
Fig. 5.
Comparison of CPs between otolith afferents and VN/CN neurons. (A) Grand CPs are plotted against neuronal thresholds for otolith afferents (red, n = 54) and VN/CN neurons (black, n = 97) (VN/CN data are from ref. 13). Solid black line indicates a type II regression fit to VN/CN data (the correlation was not significant for otolith afferents). Filled symbols represent CP values significantly different from 0.5 (permutation test: P < 0.05,). Marginal histograms show distributions of CPs for VN/CN neurons (black) and otolith afferents (red). Filled and open bars indicate neurons with significant and nonsignificant CPs, respectively. Arrowheads illustrate mean values. (B) Scatter plot of CPs against response variance. Filled and open symbols indicate neurons with significant and nonsignificant CPs, respectively. Horizontal dashed lines indicate the chance level (0.5) for CP.

