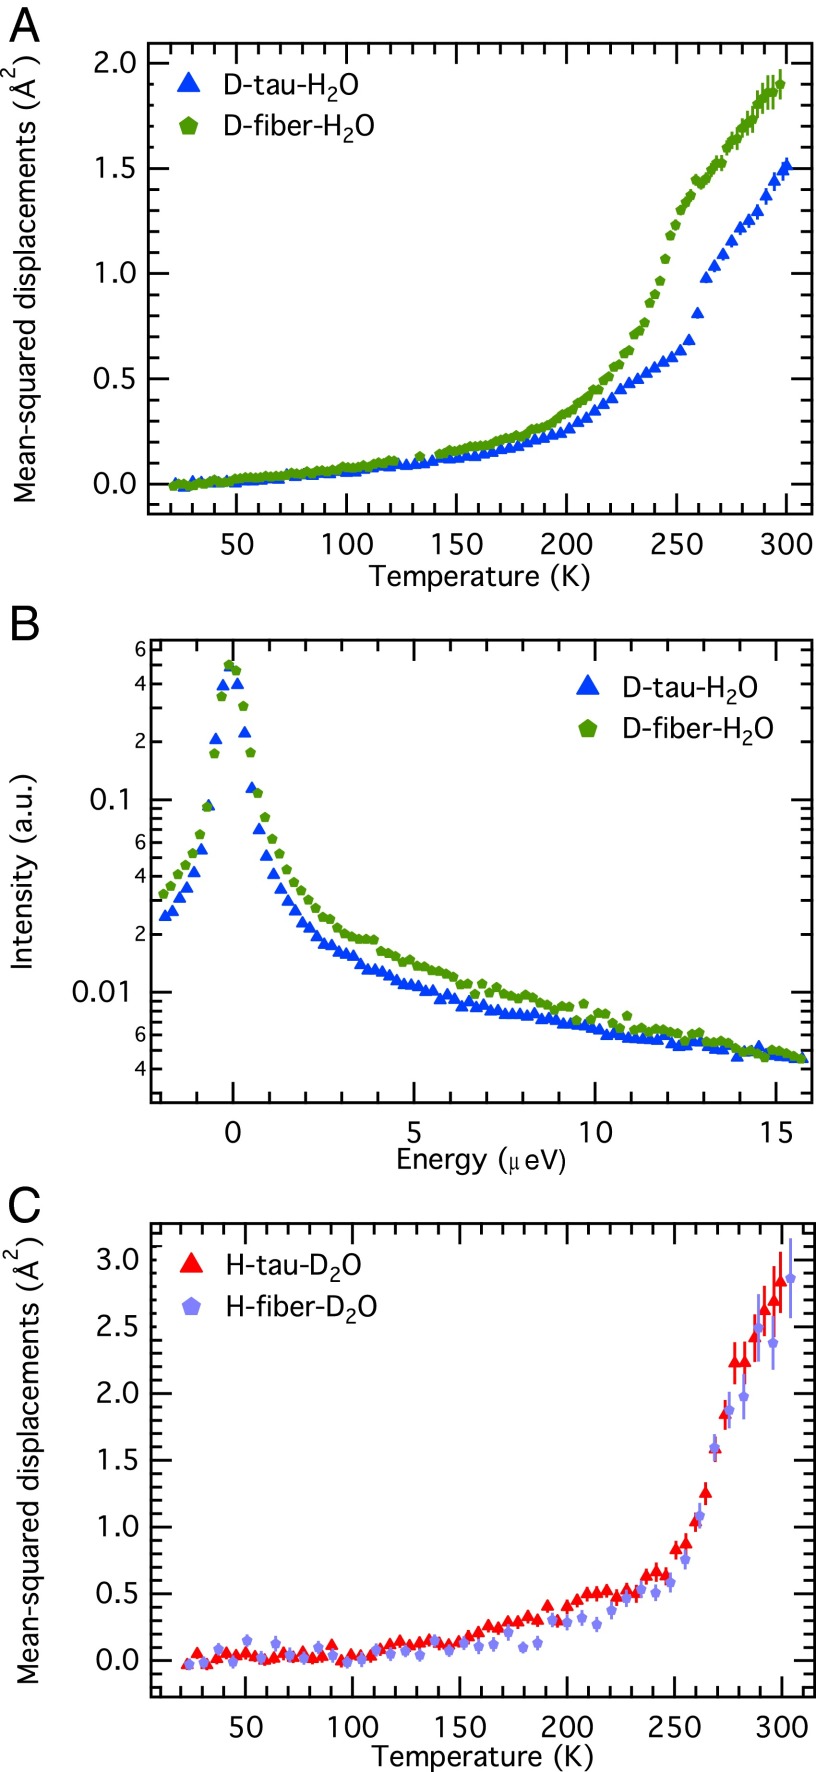
Fig. 3.
(A) MSD of the hydration water around monomers (D-tau-H2O) and fibers (D-fiber-H2O) of the tau protein. The MSD were extracted from the Gaussian approximation fitted between q values of 0.78 Å−1 and 1.76 Å−1. (B) Comparison of the raw QENS spectra of D-fiber-H2O and D-tau-H2O at 280 K, binned over q values from 0.45 Å−1 to 1.66 Å−1. The spectra of D-tau-H2O were extracted from Schiró et al. (29). For a visual comparison, the spectra were scaled with a multiplicative factor and corrected for a linear background. Because QENS spectra are symmetrical, the focus was put on positive energy exchange. (C) MSD of monomers (H-tau-D2O) and fibers (H-fiber-D2O) of the tau protein. They were extracted from the Gaussian approximation with a q4 correction between q values of 0.43 Å−1 and 1.93 Å−1. The error bars represent the SD output from the fitting procedure. Data on H-tau-D2O were taken from ref. 13 and reanalyzed.

