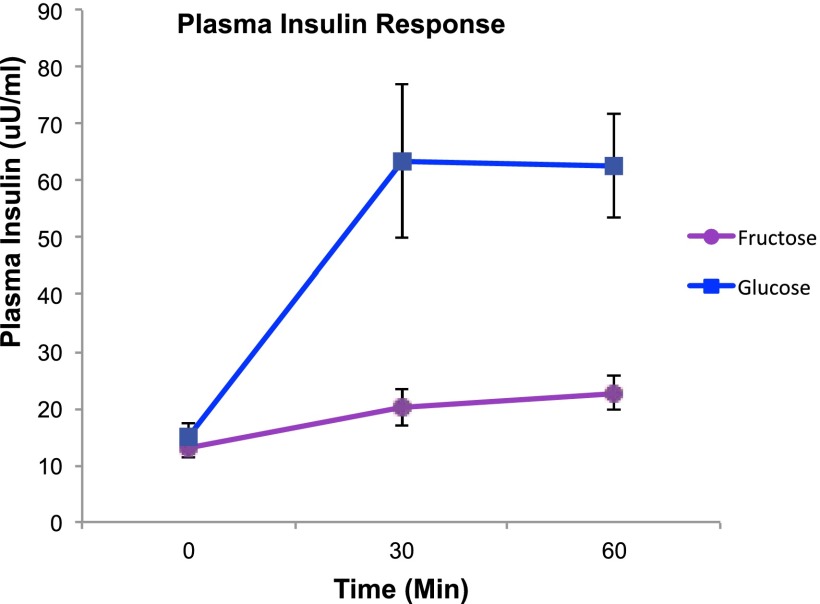
Fig. 1.
Plasma insulin response to fructose and glucose ingestion. The x axis represents time points when plasma insulin was measured at baseline (0 min) and after the ingestion of the fructose (circles) or glucose (squares) drink, and the y axis represents the SE of mean plasma insulin levels in μU/mL. To convert insulin values to pmol/L, multiply by 6.945. Data are based on 24 participants.

